

- Home
- Illustrator
- Discussions
- Betreff: Graph tool in Illustrator format/layout b...
- Betreff: Graph tool in Illustrator format/layout b...

Copy link to clipboard
Copied
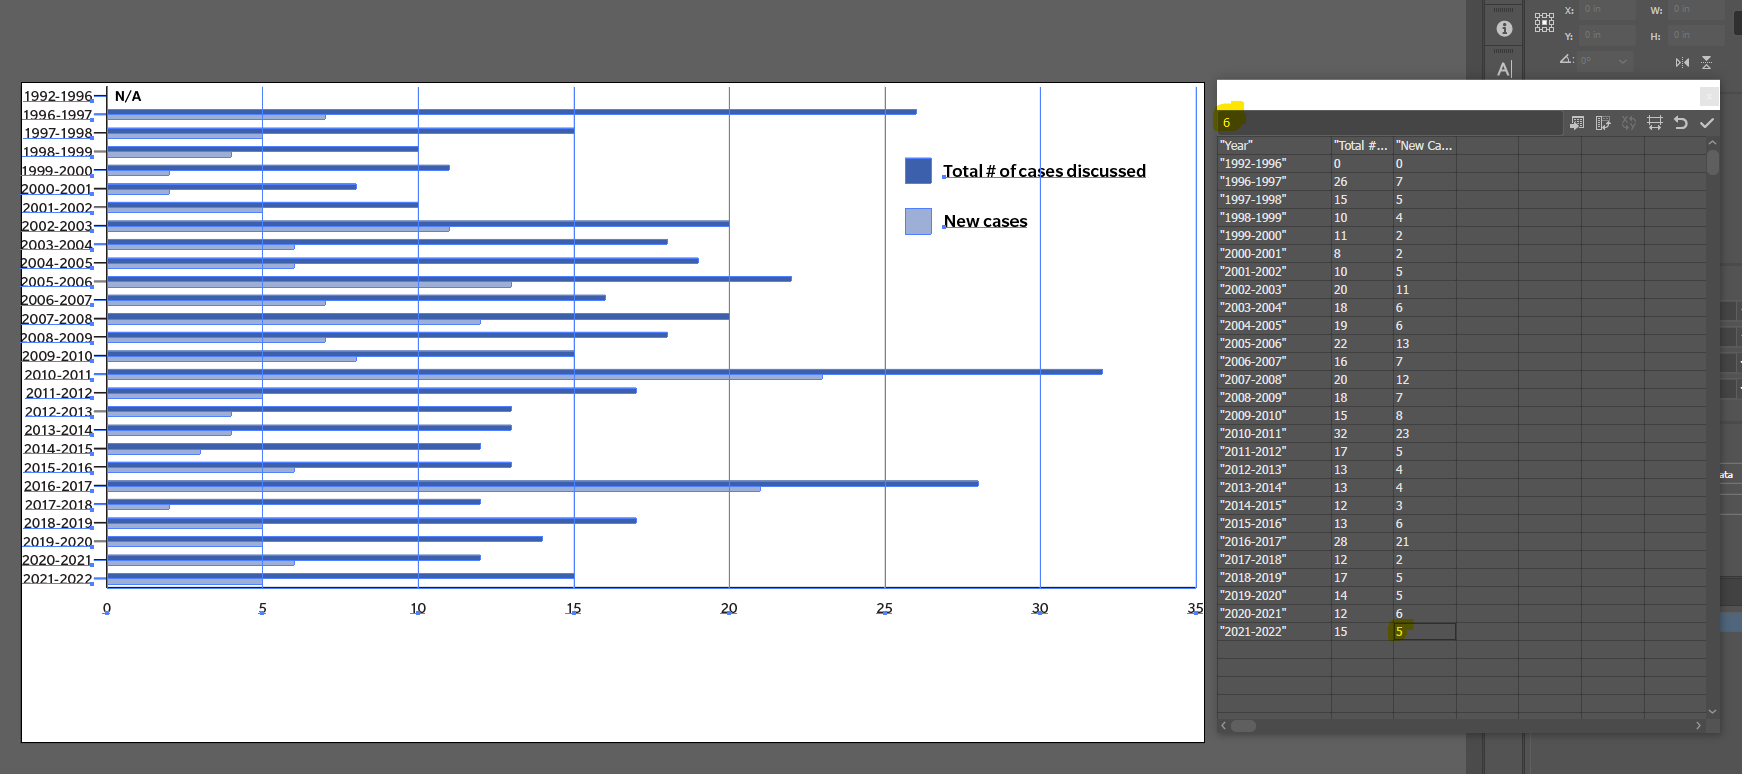
I cannot figure out why this is happening. We want to update the bars in year 2021/2022 to 6 and 15. When we input the new data, the legend moves all over and resizes and the entire graph shifts around. Note, the "NA" in the first item is a separate object, the data is 0 for that item. Any ideas?
1. Screenshot showing the graph to start, no issues here.
2. Screenshot showing the data input, highlighted in yellow; number changes from 5 to 6.
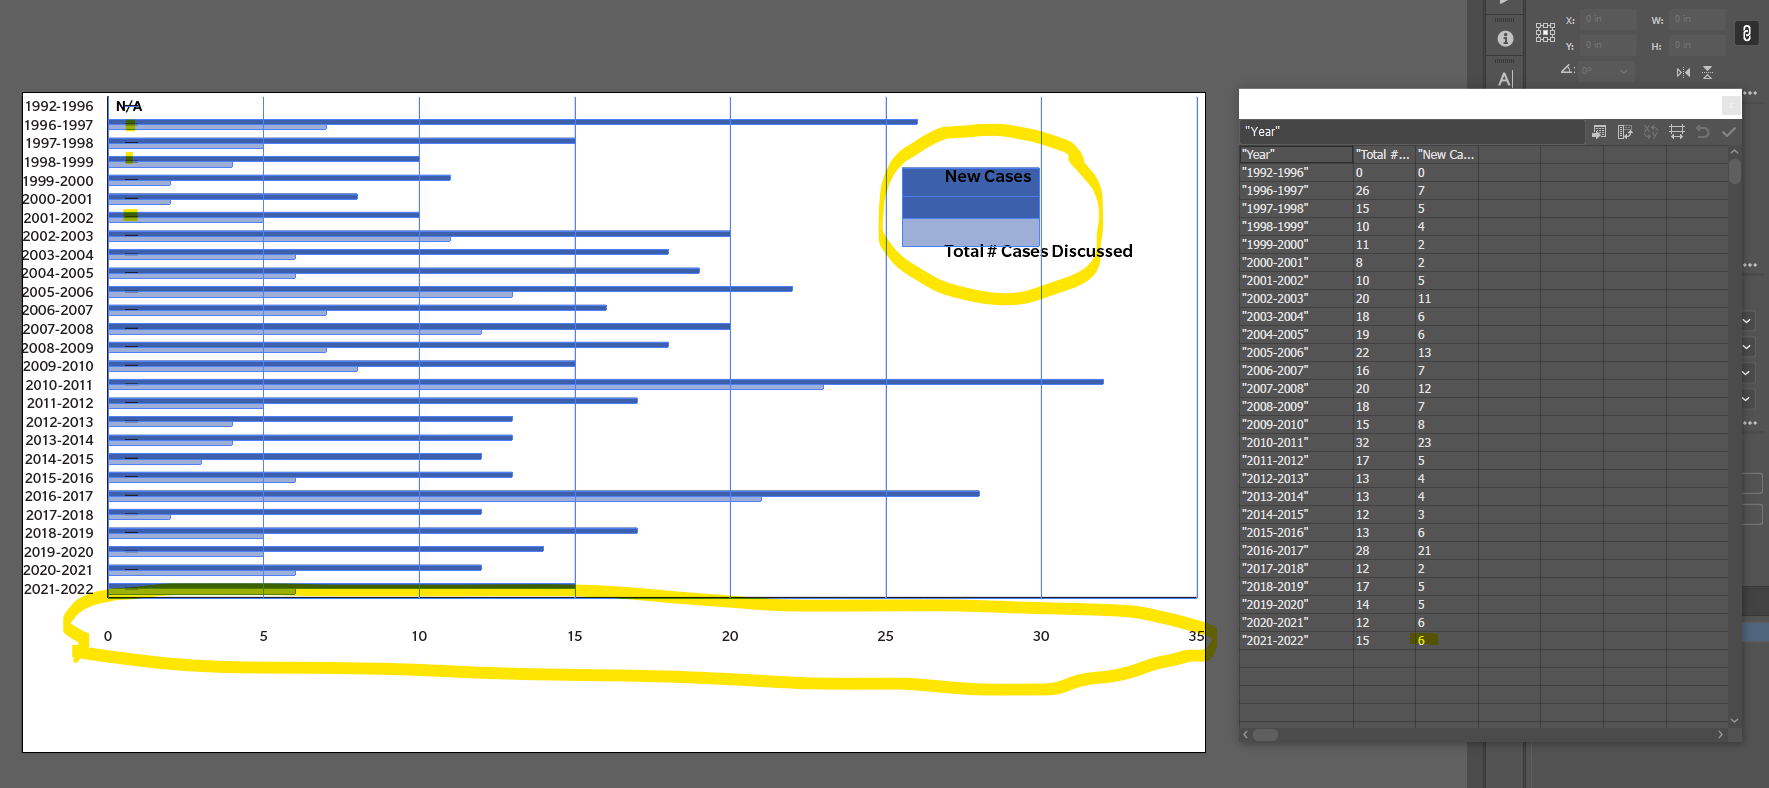
3. Screenshot showing the graph after data input, everything is messed up. Highlighted in yellow: the x-axis moved, the legend got bigger and the labels are off centre, (hard to see) there's additional bars/objects that appeared on every bar on the graph.


 1 Correct answer

You don't need to create a completely new graph, but it just is entirely possible that you have to just redo the editing.
This doesn't happen every time you update data, sometimes you might be lucky.
Explore related tutorials & articles
 8
Replies
8
8
Replies
8
Copy link to clipboard
Copied
Can you please embed the screenshots in the post. They are hard to compare when loading them one by one. Also: they don't load for me.
Copy link to clipboard
Copied
Sorry! I can't figure out how to edit the original post. Here are the screenshots again:


Copy link to clipboard
Copied
Did you edit the graph after creating it? Looks like you did.
The graph feature is very old and what you are experiencing is a common issue when updating the data table unfortunately
Copy link to clipboard
Copied
Someone else created it but I think the intention was that it could be updated as data changes, but it sounds like this only functions when you input the data set once. Then you'd have to create a new graph if you wanted to change the data, is what you're saying?
Yep in my research I found out they haven't updated this feature in a long time. I just wanted to make sure I wasn't missing something obvious but if it's just how it functions that's what I'll tell the person who wants this edited.
Copy link to clipboard
Copied
You don't need to create a completely new graph, but it just is entirely possible that you have to just redo the editing.
This doesn't happen every time you update data, sometimes you might be lucky.

Copy link to clipboard
Copied
It happens EVERYTIME I update my data. I have to redo the styling, and it kinda just jumbles up all the styling changes into a weird picasso-mess that I didn't even do before data was updated. I wish they would update the graph tool to save style changes even after data is updated... It's been 30 years guys.
Copy link to clipboard
Copied
Please post bugs & feature requests to http://illustrator.uservoice.com
That is where the engineers discuss.

Copy link to clipboard
Copied
Anything you move or style manually to the auto generated illustrator graph has to be done again every time you update the data. I end up retyping the x and y axis categories and create my own legends, I set all the stuff to the colour none thats automatically generated so you can't see it and overlay the new text and legend on top. The stuff auto generated will not be seen just your text that you created and it will remain the same as you update the data in the pie, bar or lines etc. This is something that needs to be updated by Adobe!

Find more inspiration, events, and resources on the new Adobe Community
Explore Now
 AdChoices