- Home
- Illustrator
- Discussions
- Re: How can I create a simple donut chart in Illus...
- Re: How can I create a simple donut chart in Illus...
Copy link to clipboard
Copied
Hello, I wanted to create a simple donut chart in illustrator. (image attached).
Methods I have tried:
1. Creating a circle, adding color to the stroke, and then trying to put another shape on top and then using the pathfinder (minus/divide). It simply moves the stroke around the rectangle shape.
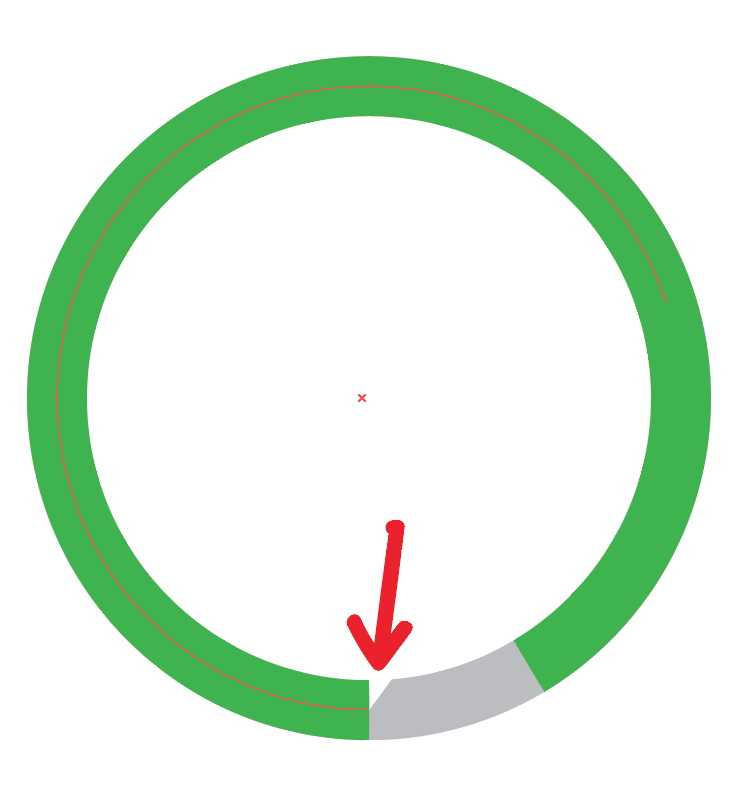
2. Creating a circle and using the scissors. - this almost gets me there, except it creates a little white space the I don't know how to remove. (image attached).
3. I then tried to create a pie chart, thinking I could easily add a white circle over it and merge/divide/minus them. I had a hard time exactly aligning the two, the align feature didn't work exactly, so I manually tried to align them, and while close, they weren't perfect.
Is there an easy way to create a simple two color donut chart?


 1 Correct answer
Ron,
I believe 2) is the simplest way, but you seem to have a green Stroke and a white Fill for the selected path (and also a white fill for the other paths), and I believe you see a snippet of that fill on top of the grey stroke where the arrow points.
You should set the Fill to None (from the start, before cutting the circle). I believe that will solve the issue.
Obviously, you should set the stroke Weight to get the right width of the doughnut.
Explore related tutorials & articles
Copy link to clipboard
Copied
Ron,
I believe 2) is the simplest way, but you seem to have a green Stroke and a white Fill for the selected path (and also a white fill for the other paths), and I believe you see a snippet of that fill on top of the grey stroke where the arrow points.
You should set the Fill to None (from the start, before cutting the circle). I believe that will solve the issue.
Obviously, you should set the stroke Weight to get the right width of the doughnut.
Copy link to clipboard
Copied
Thanks!!! I removed the fill setting and it worked perfect. I had overlooked the fill setting. Thank you!!!
Copy link to clipboard
Copied
For my part you are welcome, Ron.
Copy link to clipboard
Copied
Maybe the little white space is cause by GPU rendering.
Switching between GPU and CPU rendering may solve this: Cmd E (Mac), Ctrl E (Win)
Copy link to clipboard
Copied
Forget my suggestion about the GPU rendering, I tried it and it does not make a difference.
Jacob's way (setting the fill to None) should help.
Copy link to clipboard
Copied
I find the easiest way to create simple, accurate doughnut charts is to add it to a gradient within the stroke. If you give the gradient hard edge colors and apply to the stroke you will get the result you are looking for.
Here is a quick video to show you how easy it really is:
(Right click+Alt and drag to create other gradient sliders)
Hope this helps.
Copy link to clipboard
Copied
Thanks! I didn't know how to create the hard edge gradient - this is awesome. Wish I could give two correct answers! I will be using this technique in the future!
Copy link to clipboard
Copied
Glad to help. ![]()
I find this the fastest and most accurate way of doing a small number of sections, say up to 4-5 but if you go above that you would be best using the pie chart tool and then expanding it, then laying a circle over the top of the chart and then using the pathfinder tool to divide.
All the best.
Copy link to clipboard
Copied
To make a donut chart in Illustrator, use the Pie Graph tool, select the Stacked option, make sure First Row in Front is checked.
In your Graph Data, add a row at the top with no value - this will create the hole in the middle of your donut. Add the values you want to display for your chart in the second row.
Copy link to clipboard
Copied
So easy this way. Thank you.
Find more inspiration, events, and resources on the new Adobe Community
Explore Now


