Kurt Gold • Community Expert, Oct 24, 2018Oct 24, 2018
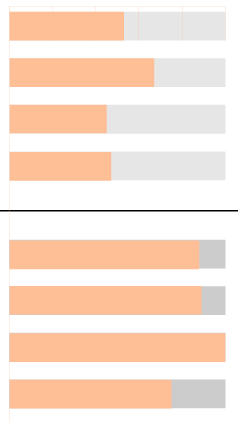
Is that a "live" chart in Illustrator (created by one of the Chart tools)?
Then just direct select (White pointer) the parts that are going to be recoloured and apply the desired colours (ideally, apply a graphic style that implies the fill colour).
/t5/illustrator-discussions/how-to-change-the-color-one-bar-in-a-bar-chart/m-p/10168616#M115237Oct 24, 2018
Oct 24, 2018
Copy link to clipboard
Copied
A few questions for you: are the bars you want to change separate objects, or are they grouped together? Are the parts you want to change all the same color, or are they slightly different?
/t5/illustrator-discussions/how-to-change-the-color-one-bar-in-a-bar-chart/m-p/10168617#M115238Oct 24, 2018
Oct 24, 2018
Copy link to clipboard
Copied
LATEST
Is that a "live" chart in Illustrator (created by one of the Chart tools)?
Then just direct select (White pointer) the parts that are going to be recoloured and apply the desired colours (ideally, apply a graphic style that implies the fill colour).


 2
Replies
2
Replies


 AdChoices