The key to sizing the graph marker design is the proportion of the square in relation to the design.
If the square is small in proportion to the design, like this -- shown in outline view on the left and in preview view on the right --


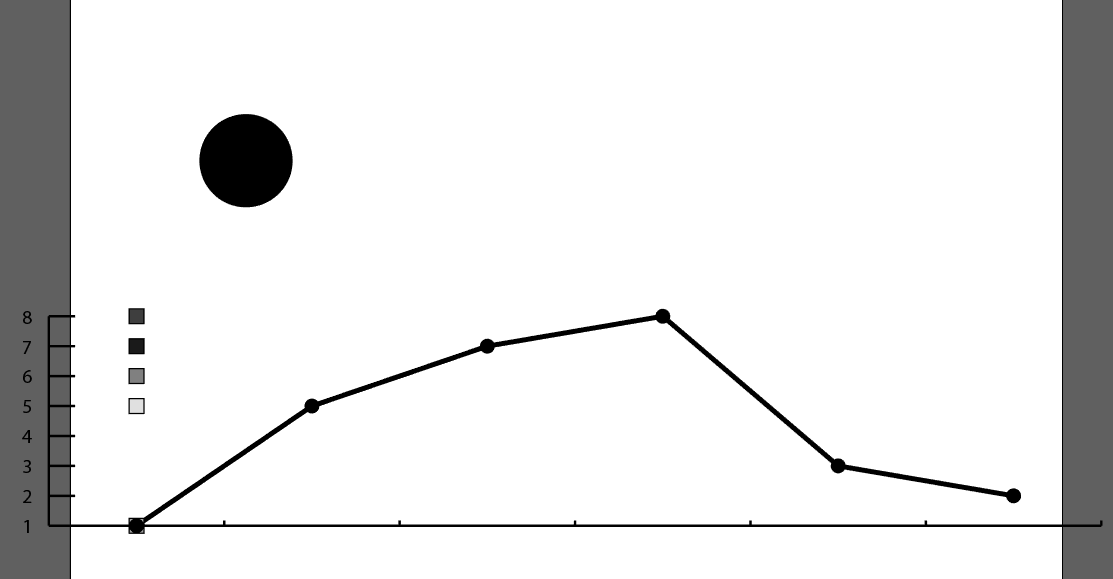
The graph could look like this:

If the square is large in proportion to the design, like this:


The graph could look like this:

In other words, the larger the square is, the smaller the marker design will be.
In both of the example above, the marker design is exactly the same size. Only the rectangle is different in size.
Small rectangle = large marker design. Large rectangle = small marker design.
I hope this helps.


 2
Replies
2
Replies


 AdChoices