


Copy link to clipboard
Copied
Hi All,
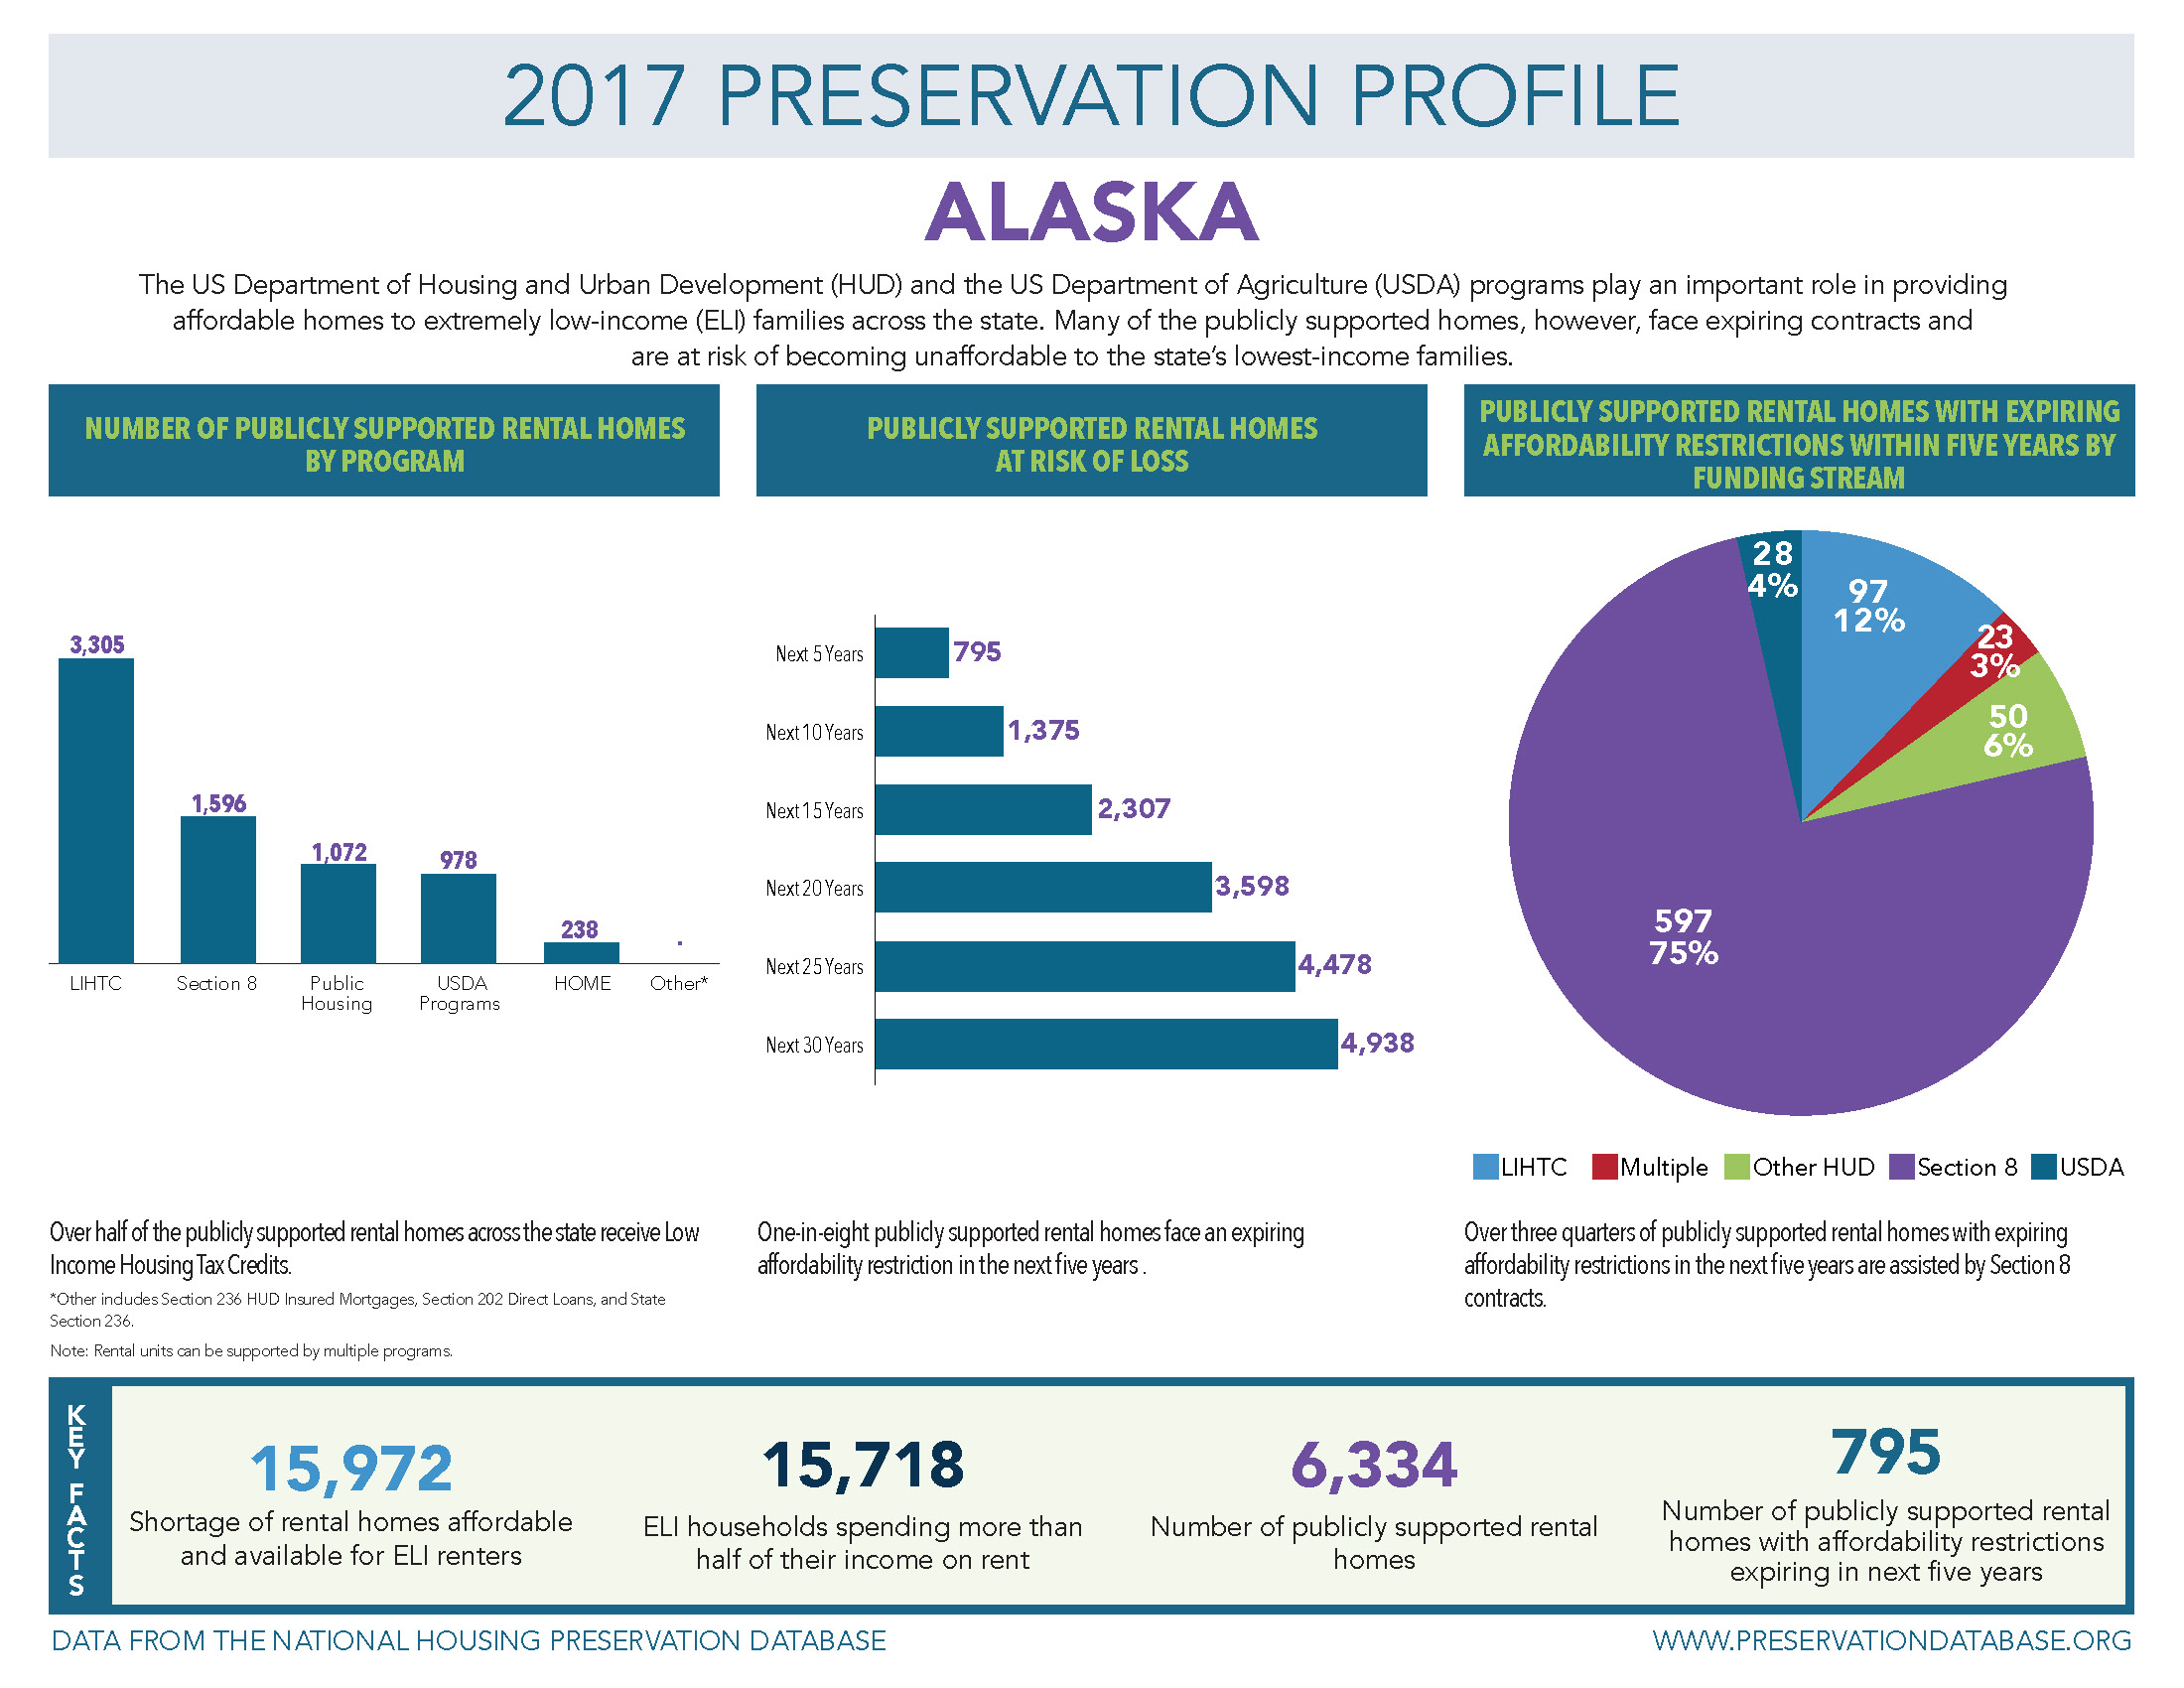
Here's the deal, I need to create a total of 153 graphs that will be part of an infographic for each state. There are 51 bar charts, 51 column charts, and 51 pie charts.
Here is the infographic:
Last year, it took me 3 weeks to create each chart for each state. I had to copy the chart from Excel, Paste into Illustrator and then stylize each one and save each individual chart. Each chart is sized specifically to merge into Indesign along with the data points. It was painstaking and arduous, but I got it done.
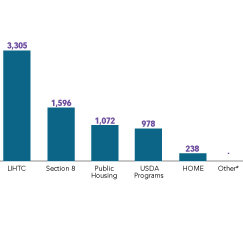
NOW, I have to redo all the charts again, however, i don't have as much as a window to get them done. I've tried using the Illustrator Graph tool, but point plank, IT'S HORRIBLE. For instance, on this chart below, I cannot remove the value axis, and for some reason I cannot add the value labels above the chart:
The other issue is that I received the Excel Table and each chart is a Pivot Chart, so when I try and do it old-school, it pastes in a format that I can't edit it. What I am looking for is something EASY and SEAMLESS that will work with Illustrator.
Are there any Plug-Ins that anyone knows of that can do this? What about any Excel Extensions. Any online tools out there for charts? I'm at a loss here and I don't have 3 weeks to get these done.
Please help!!!!


 1 Correct answer

Hi Ellen,
Please check out this video tutorial and let us know if that helps or if you need any further assistance.
Creating Graphs in Adobe InDesign - YouTube
Regards,
Srishti
Explore related tutorials & articles
 9
Replies
9
9
Replies
9

Copy link to clipboard
Copied
Try export your charts from excel as PDF file than open this PDF in illustrator
Copy link to clipboard
Copied
Thank you, but that's not quite what I need. Even if I do it that way, I still have to open each chart, remove all the clipping paths, stylize it, and change the fonts and the colors and resave as an eps. What I want is to find a way so that I have the design already set up precisely they way I want it, and to Merge in the data to automatically create the charts. Is there something like that???

Copy link to clipboard
Copied
Try the Variable Importer Script:
http://hypertransitory.com/blog/2015/04/26/illustrator-variable-data/
Copy link to clipboard
Copied
Yes, thank you for this, but again. This partly solves my problem.
Part of the issue is that I cannot create a graph that will look like the way I want it to look. For instance, I cannot create a bar graph that does not have a Y-Axis on the left side, nor can I create one where it will let me add the numbers above the bars, like the example above.
Copy link to clipboard
Copied
To get numbers above the bars, you will have to create your own custom bar design (please refer to the documentation).
To make the axis vanish, select it with the direct selection tool and set its stroke to "None"
You have to get creative with graphs, but a lot is possible.
Copy link to clipboard
Copied
Deleted Spam Post.
Please do not share your Adobe ID and Password with anyone on Forum. Adobe never asks for account related details(Like Passwords).
Copy link to clipboard
Copied
Hi Ellen,
Please check out this video tutorial and let us know if that helps or if you need any further assistance.
Creating Graphs in Adobe InDesign - YouTube
Regards,
Srishti

Copy link to clipboard
Copied
You gave a link to a third-party font that's expensive and severly limiting; is there any solution on the horizon?
Copy link to clipboard
Copied
Let's be real - that font, Chartwell, is expensive (I paid for it), it only works for whole numbers that aren't very numerically high (millions don't work for example), and because the company is out of the USA, support is pretty difficult to receive. And since none of these limitations are documented ahead of time in the purchase process, you feel like you're getting deceived when you try to use it.
Adobe really needs to provide some better, native tools inside of InDesign for chart creation; having to break apart Illustrator charts and manually recreate all the labels just to be able to make them look nice is a terrible process. If Microsoft software is a better benchmark for creating more appealing charts without a massive amount of effort, we've got some issues....

Get ready! An upgraded Adobe Community experience is coming in January.
Learn more
 AdChoices