Copy link to clipboard
Copied
Hi,
I have read the doc where you are told to attach the idjs to the UDT app in order to debug a script. I get to that stage just fine. However, I can't see my console.log calls in the console (nor in the logs files).
Any ideas about what I am doing wrong here?
Loic
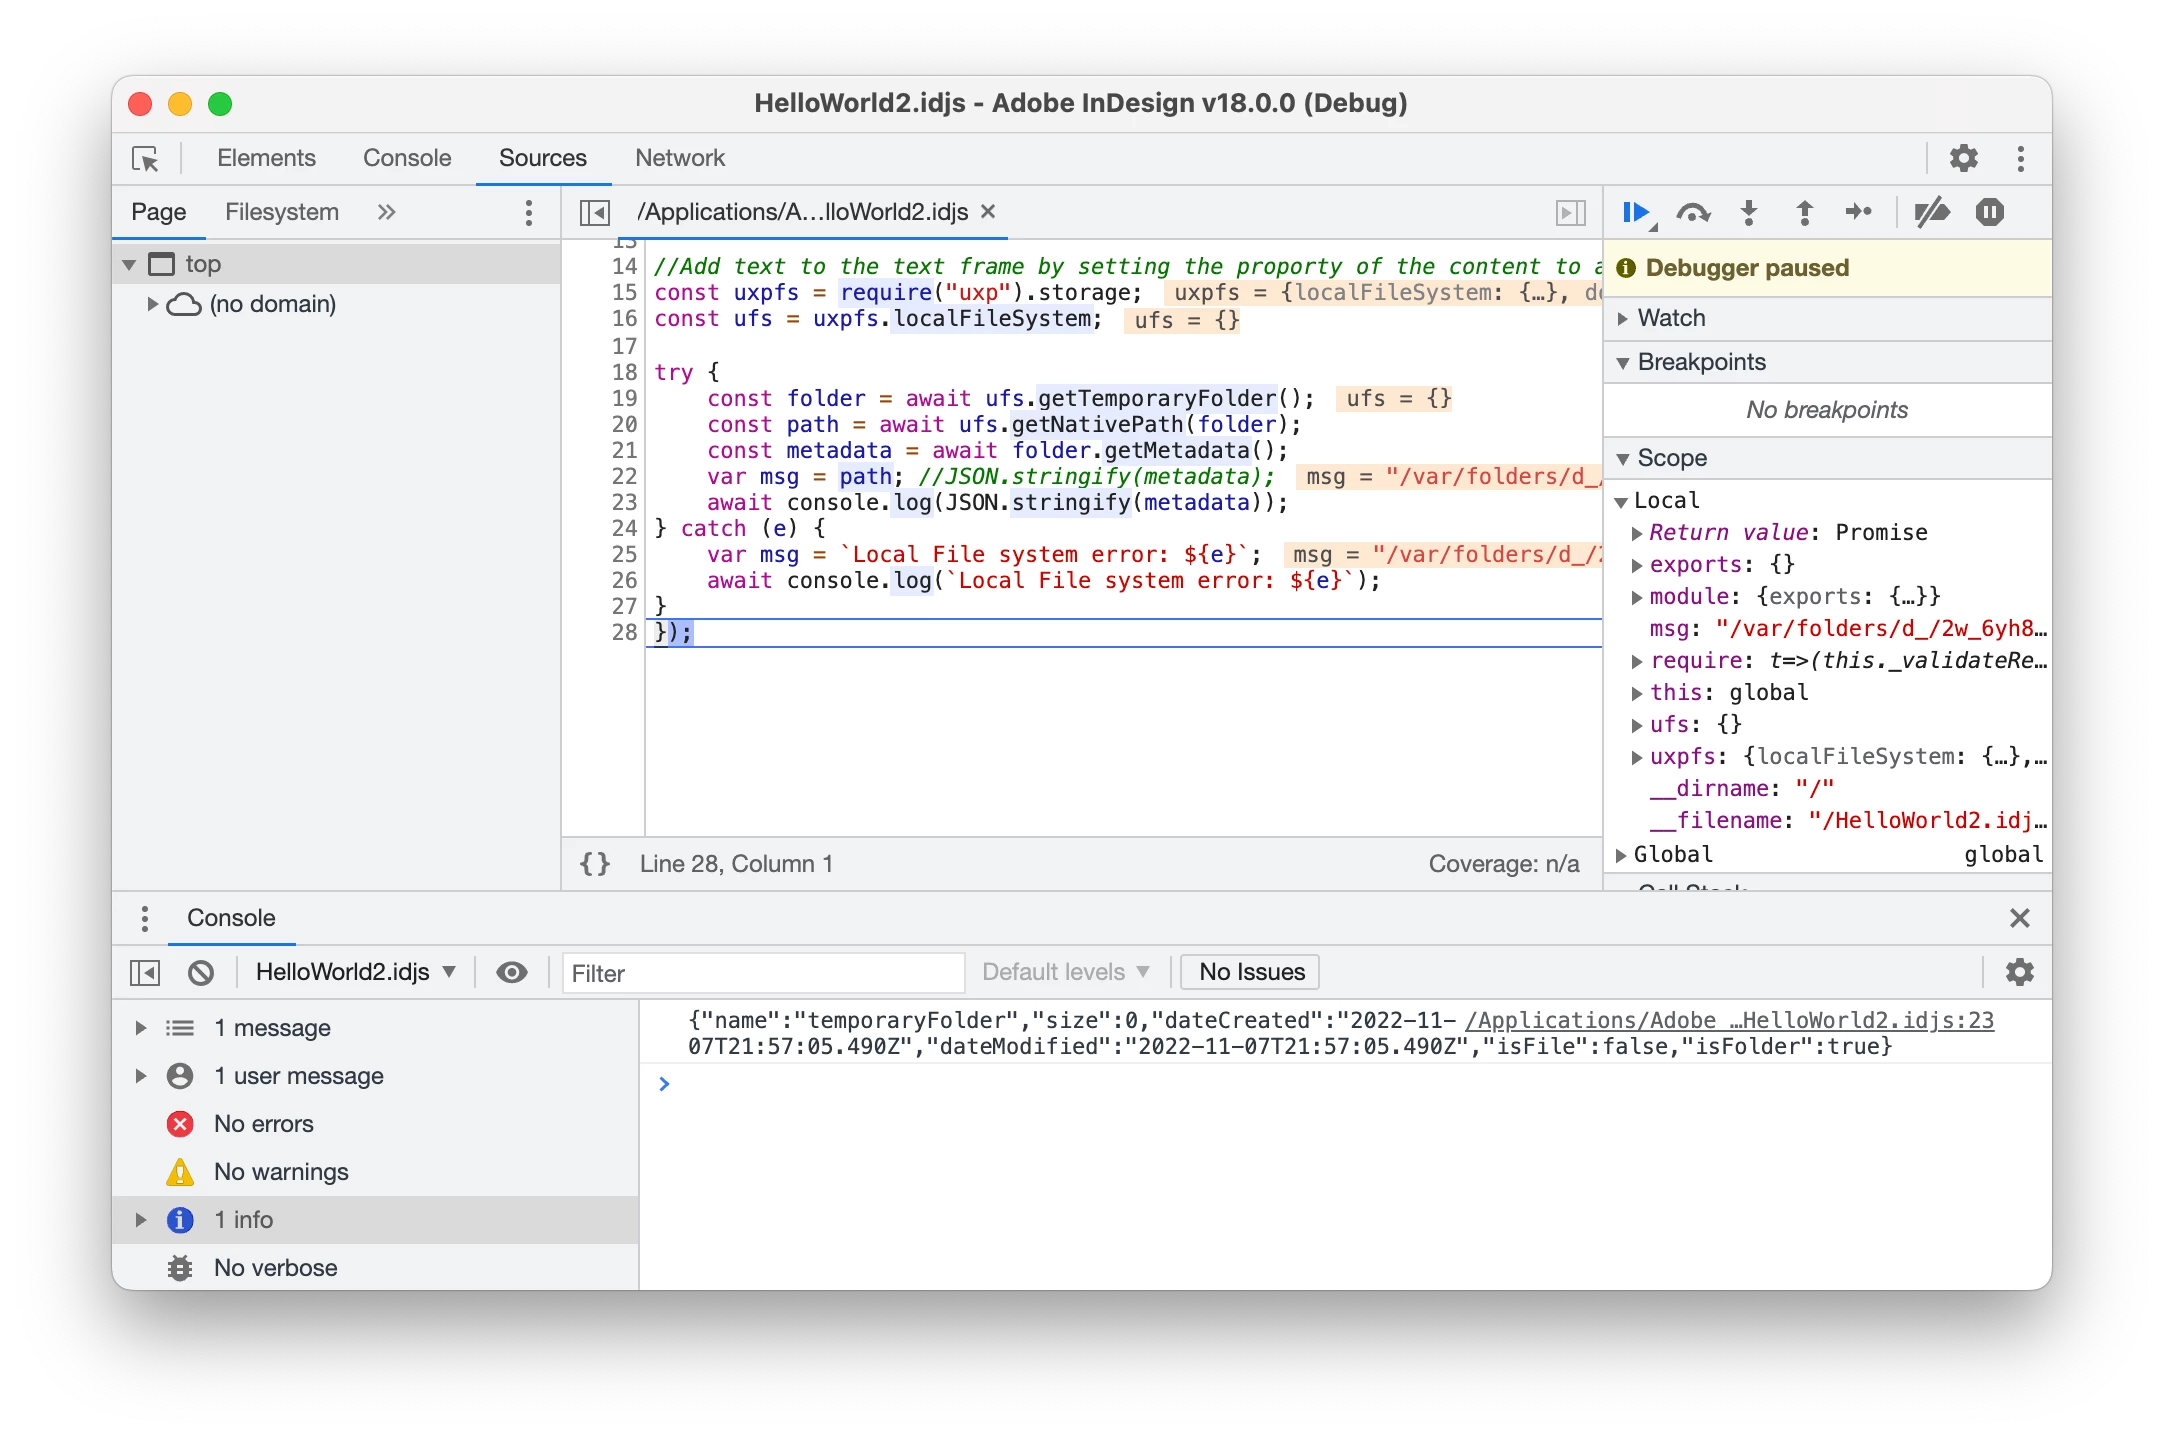
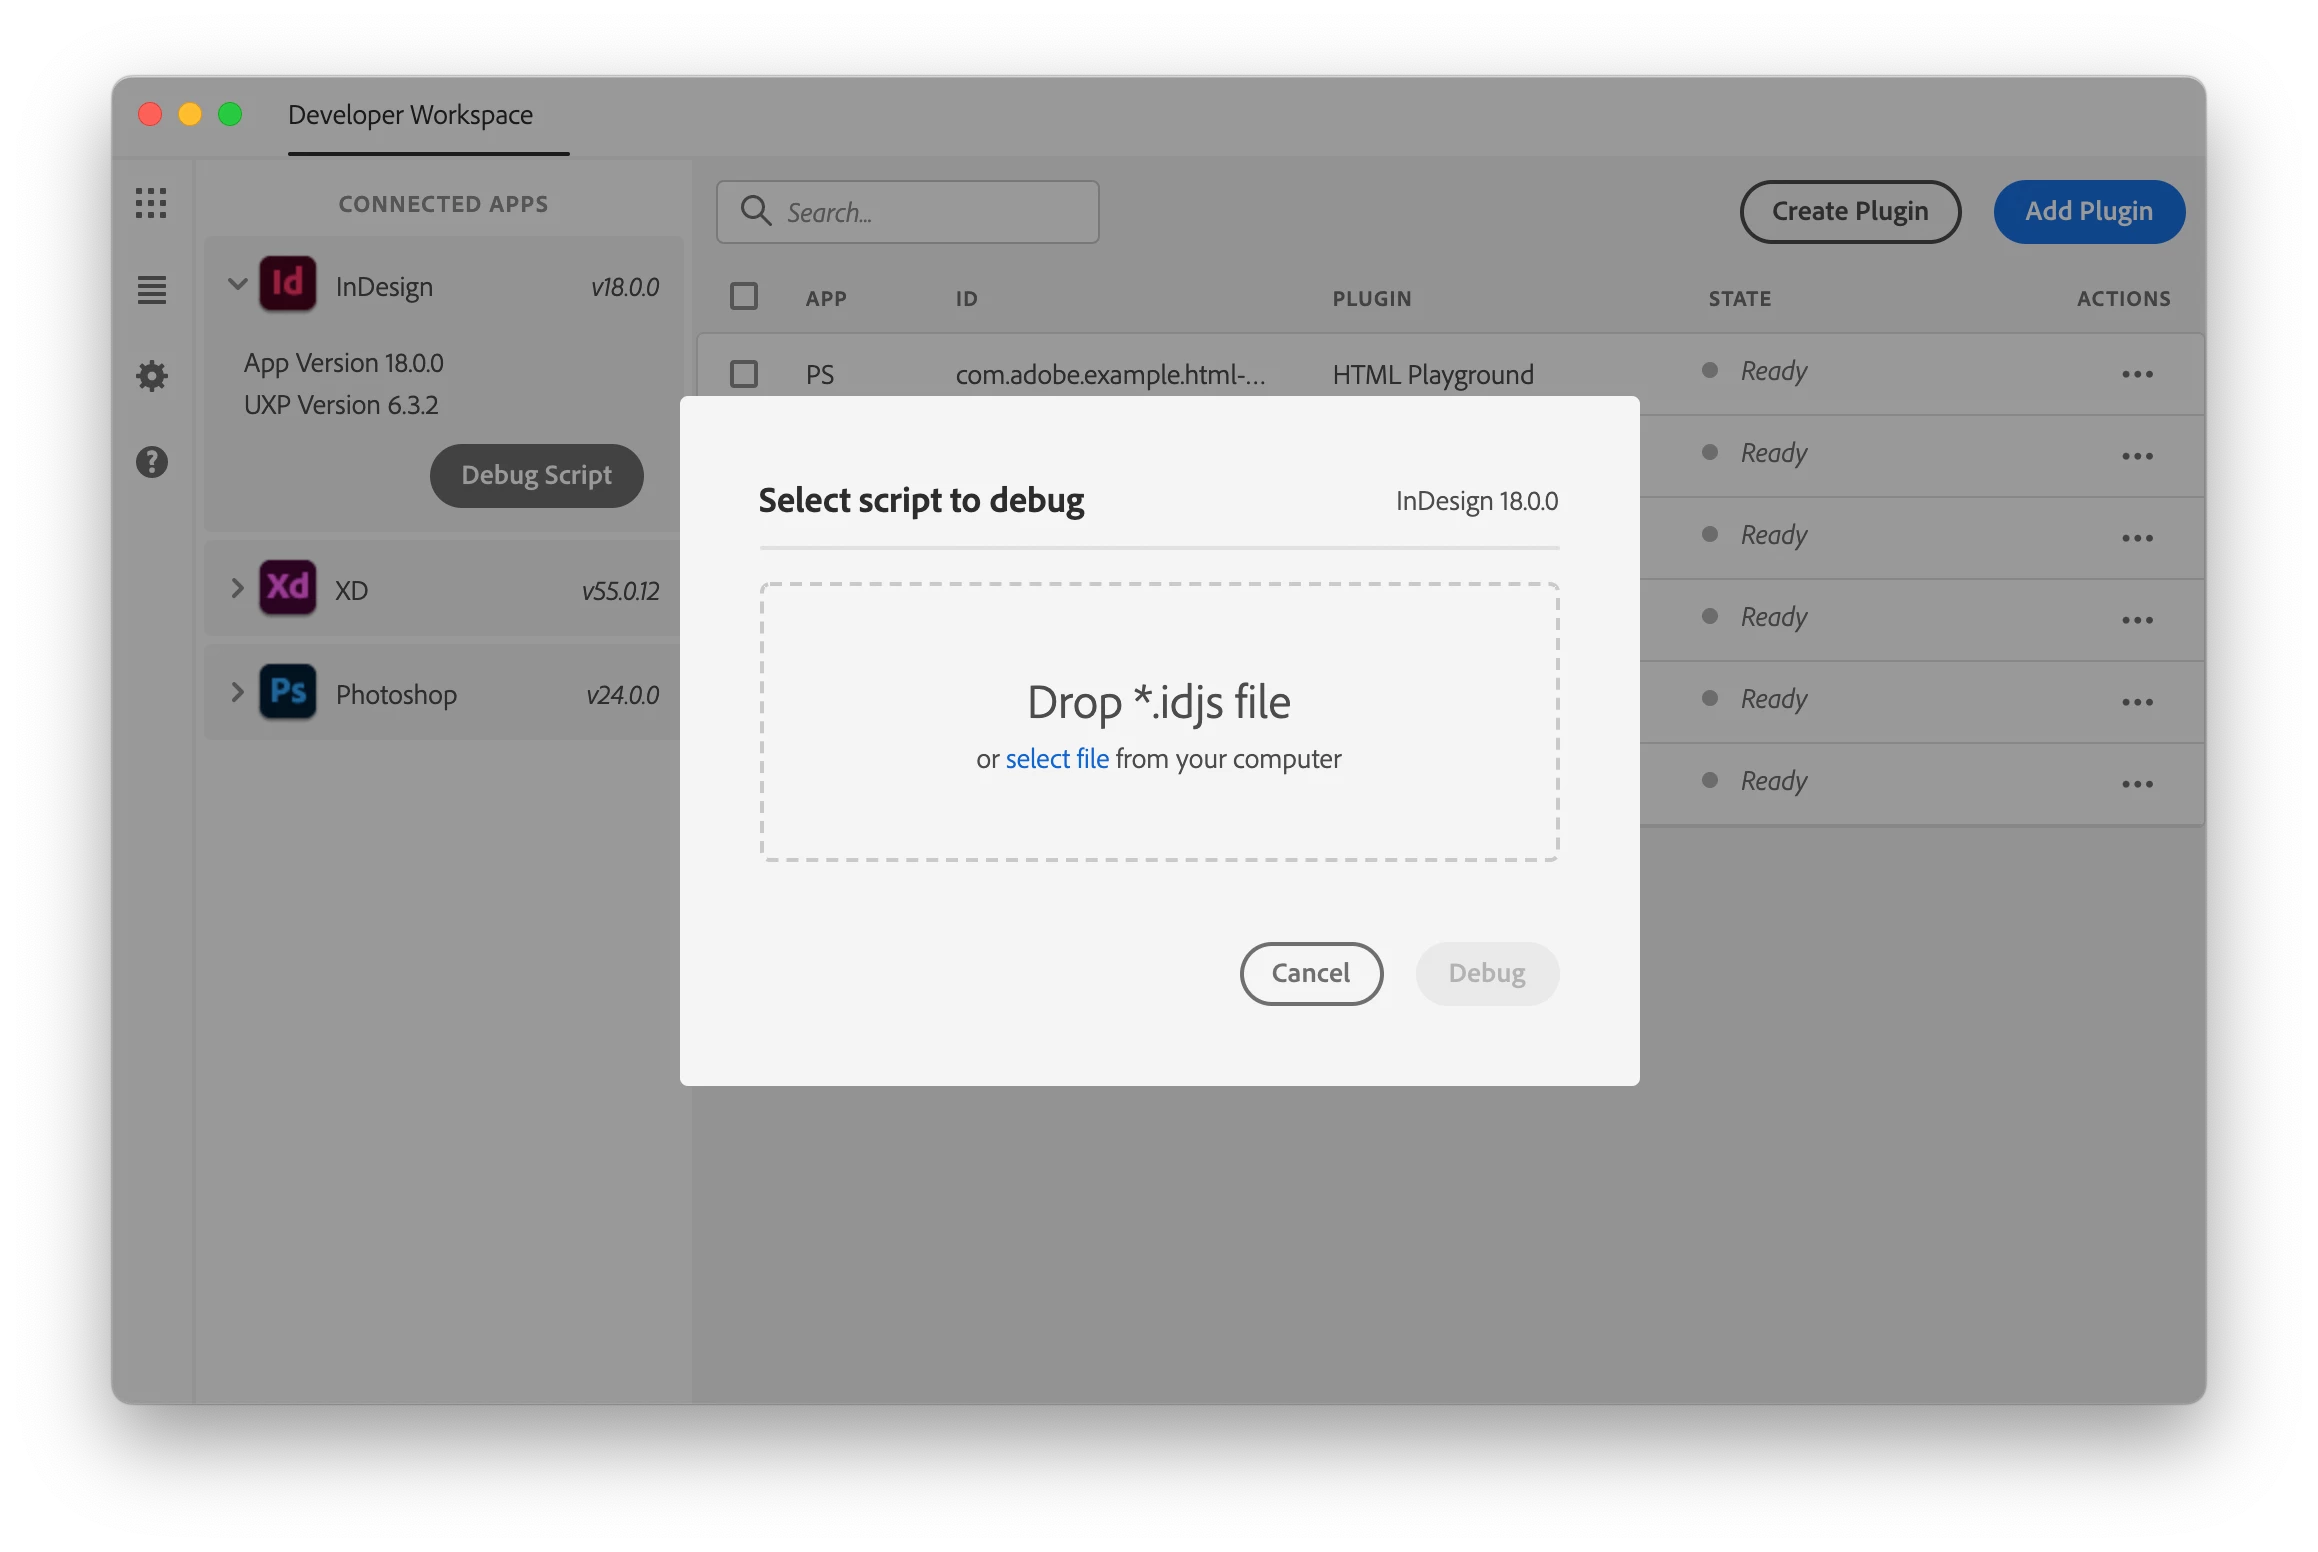
Hi @Loic.Aigon , if you open UDT, find your connected app in the list and then click "Debug Script", then select/drop in your script file there and click "Debug", you should see the debugging window open where you can step through the code and see your console.log statements printed etc. I attached screenshots for reference. Also, be sure to also have InDesign running for it to show up in the connected apps list in UDT. When you run your script in InDesign directly, those console statements shou
...Copy link to clipboard
Copied
@amandahuang says:
If they aren’t using global await that could be an issue (script finishes running and execution context is destroyed so any logs that may be logged would be destroyed as well)
Copy link to clipboard
Copied
Hi @Erin F.
Thanks a lot for the feedback. Still no sure about it, here is a piece of code from UXP Scripting doc:
const uxpfs = require("uxp").storage;
const ufs = uxpfs.localFileSystem;
try {
const folder = await ufs.getTemporaryFolder();
const path = await ufs.getNativePath(folder);
const metadata = await folder.getMetadata();
var msg = path; //JSON.stringify(metadata);
await console.log(JSON.stringify(metadata));
} catch (e) {
var msg = `Local File system error: ${e}`;
await console.log(`Local File system error: ${e}`);
}
The code works (I get the result in the document for now) but still no output in the console.
Am I right to expect the console.log calls to appear in the UDT Debugguer once I run my script within InDesign from the scripts palette? Or did I miss an obvious part of the docs that tell us how to proceed for debugguing and getting the calls to appear in the console?
Thanks in advance,
Loic
Copy link to clipboard
Copied
Hi @Loic.Aigon , if you open UDT, find your connected app in the list and then click "Debug Script", then select/drop in your script file there and click "Debug", you should see the debugging window open where you can step through the code and see your console.log statements printed etc. I attached screenshots for reference. Also, be sure to also have InDesign running for it to show up in the connected apps list in UDT. When you run your script in InDesign directly, those console statements should be getting logged in a file under the <youruserid>/Library/Caches/UXPLogs folder.
Hope that helps,
Holly
Copy link to clipboard
Copied
Hi Holly,
It sure helped. Thanks a lot. My mistake was to run the script from within InDesign and expect the debugger to react. Now it's totally clear to me.
Best,
Loic
Copy link to clipboard
Copied
Hi @hollyschinsky,
I'm working with the server variant of InDesign and I can't find the path you specified (<youruserid>/Library/Caches/UXPLogs).
Can you please provide the full path for InDesign server?
Shouldn't console.log() also appear on the server console like app.consoleOut() in extendscript?
Or do I need to use a different method?