Copy link to clipboard
Copied
Hi Everyone,
The other day I upgraded my OS and have to now use Visual Studio Code.
Are there any useful resources to check I'm using VSC correctly when writing/executing my scripts?
I've installed VSC and one other question I have is, if I'm using $.writeln is there somewhere I can see the output of this as per the JS Console in ESTK ?
Thanks.
 2 Correct answers
if I'm using $.writeln is there somewhere I can see the output of this as per the JS Console in ESTK
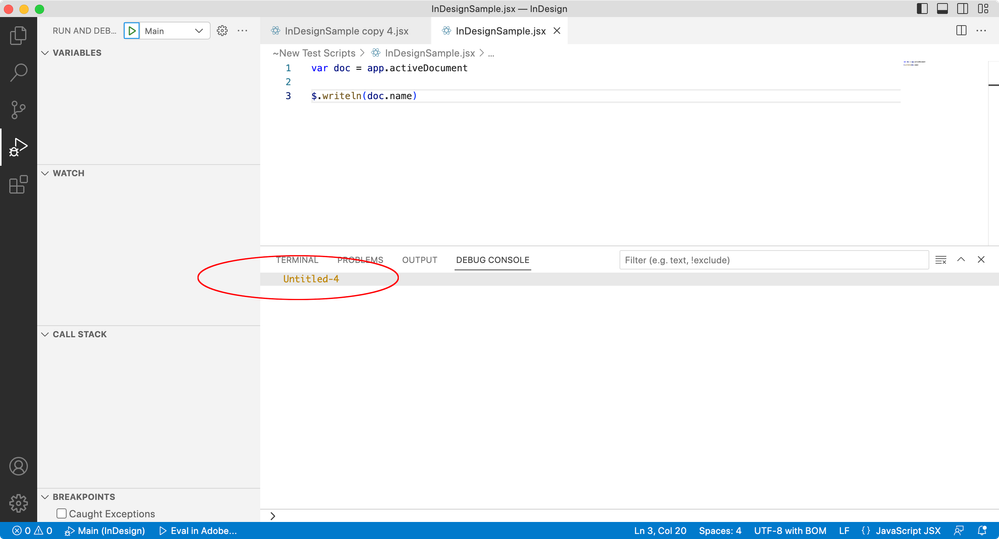
Hi @deckarduk , Also, your $.writeln() should show in the debug console panel:
Hi @deckarduk, with ExtendScript debugger for VSCode, use //@ instead of # for targetengine and include directives.
//@targetengine "main"
//@include '~/Desktop/myLibrary.js'
- Mark
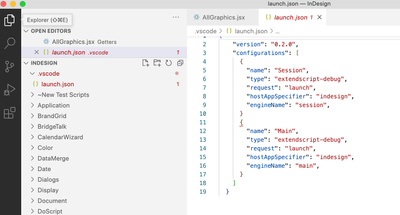
P.S. you can set the default targetengine in your launch.json file. See my example above ("engineName").
Copy link to clipboard
Copied
Hi @deckarduk, I've got lots to say about VSCode. I actually love using it, compared to the old ways. I'm assuming you have installed the ExtendScript Debugger. Here's a few quick things:
1. This is my launch.json file. Bring up the command palette and type launch.json to edit it.
{
    "version": "0.2.0",
    "configurations": [
        {
            "type": "extendscript-debug",
            "request": "attach",
            "name": "Attach Indesign",
            "hostAppSpecifier": "indesign",
            "engineName": "main",
            "hiddenTypes": [
                "builtin",
            ],
        },
    ]
}
2. Here's my debugging keyboard shortcuts. Bring up command palette and type key and choose "Open keyboard shortcuts (JSON) to edit. You'll need to set the keys how you like.
    {
        "key": "alt+cmd+.",
        "command": "workbench.debug.panel.action.clearReplAction"
    },
    {
        "key": "ctrl+alt+cmd+a",
        "command": "workbench.action.debug.stop",
        "when": "inDebugMode"
    },
    {
        "key": "ctrl+alt+cmd+a",
        "command": "workbench.action.debug.run",
        "when": "debuggersAvailable && debugState == 'inactive'"
    },
    {
        "key": "cmd+r",
        "command": "extension.extendscript-debug.evalInAttachedHost",
        "args": {
            "debugLevel": 1,
            "bringToFront": false
        }
    },
    {
        "key": "cmd+shift+r",
        "command": "extension.extendscript-debug.evalInAttachedHost",
        "args": {
            "debugLevel": 1,
            "bringToFront": true
        }
    },
    {
        "key": "cmd+.",
        "command": "extension.extendscript-debug.haltInHost",
        "when": "inDebugMode"
    },
    {
        "key": "ctrl+.",
        "command": "workbench.action.debug.stop",
        "when": "inDebugMode"
    },
    {
        "key": "ctrl+m",
        "command": "workbench.action.debug.stepInto",
        "when": "debugState != 'inactive'"
    },
    {
        "key": "ctrl+i",
        "command": "workbench.action.debug.stepOut",
        "when": "debugState == 'stopped'"
    },
    {
        "key": "ctrl+l",
        "command": "workbench.action.debug.stepOver",
        "when": "debugState == 'stopped'"
    },
    {
        "key": "ctrl+shift+l",
        "command": "workbench.action.debug.continue",
        "when": "debugState == 'stopped'"
    },
    {
        "key": "ctrl+shift+c",
        "command": "editor.debug.action.runToCursor",
        "when": "debugState == 'stopped'"
    },
3. To see the debug console, type cmd-shift-Y (MacOS) probably ctrl-shift-Y on Windows.
Hope that helps a bit. Post back if you get stuck.
- Mark
Copy link to clipboard
Copied
Hi Mark,
Wow! Thanks for all the help, that's great.
I'll work through the stuff above and see I how I get on.
Thanks again for all help 👍
Copy link to clipboard
Copied
Hi Mark,
I'm using the 'Evaluate the active file in a host application' button in the bottom bar.
Each time I have to specify a version of InDesign and then, because I'm working on a palette, select the dialog engine.
Am I using VSC correctly?
Thanks
Copy link to clipboard
Copied
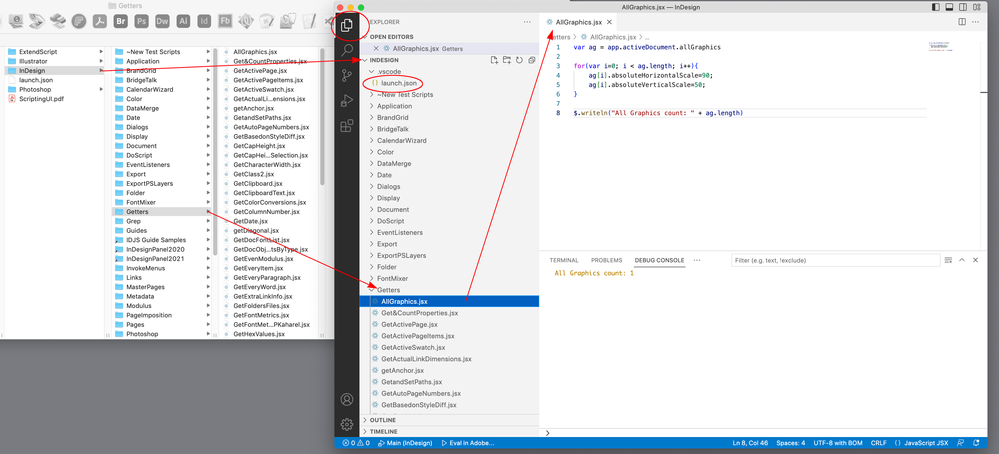
Hi @deckarduk , I’m sure Mark will have more tips, but for me the major difference between VSC and ESTK, is VSC wants you to identify a working folder for your scripts and associate a .JSON configuration for the scripts in that folder.
So, I have a folder that contains all of the InDesign scripts I want to test and use. When I open that folder via VS Codes’s File>Open Folder..., the scripts are listed in Code’s Explorer, from there I can open a script and edit or run. The launch.json file sets the debugging preferences for the scripts in the Explorer folder:
Then Run and Debug to run a script. My launch.json runs the selected script in InDesign and displays errors and writeln output in the Console
Copy link to clipboard
Copied
Hi Rob,
Thanks for the help, really appreciate it.
One of your screen grabs covers a question I was going to ask about ...
which I have in the project I'm working on. VSC tells me I have a problem with that line - ';' expected. To get the palette to execute I have to select a different engine to main - com.adobe.ccx.sharesheet.dialog_Engine_Id - is that correct?
I also have to select a version of InDesign each time I execute my script, is that correct?
I'll set up my json file as per yours and see if that helps.
Many thanks once again, Rob.
Copy link to clipboard
Copied
I also have to select a version of InDesign each time I execute my script, is that correct?
Enter in the launch.json under hostAppSpecifierEnter your current version number of InDesign in the launch.json under hostAppSpecifier:
"hostAppSpecifier": "indesign-18.064"Mario
Copy link to clipboard
Copied
Hi @deckarduk, with ExtendScript debugger for VSCode, use //@ instead of # for targetengine and include directives.
//@targetengine "main"
//@include '~/Desktop/myLibrary.js'
- Mark
P.S. you can set the default targetengine in your launch.json file. See my example above ("engineName").
Copy link to clipboard
Copied
Thanks for the help Mario 👍
Copy link to clipboard
Copied
if I'm using $.writeln is there somewhere I can see the output of this as per the JS Console in ESTK
Hi @deckarduk , Also, your $.writeln() should show in the debug console panel:
Copy link to clipboard
Copied
Hi Rob,
Many thanks for the help.
Glad to see we can still do that sort of thing, I use it quite a lot.
I've only spent 1.5 days using VSC so still learning and the upgrade came during a reasonable sized project.
Thanks again 👍
Copy link to clipboard
Copied
@deckarduk, there is some info in this thread, too.
Copy link to clipboard
Copied
Hi @m1b,
A question, by replacing # with //@ we would make VSCode happy but would that execute fine when the script would be executed by other means. Let's say via the Scripts Panel?
-Manan
Copy link to clipboard
Copied
Hi @Manan Joshi, it has never been a problem for me. - Mark
Find more inspiration, events, and resources on the new Adobe Community
Explore Now


