
How to import Matplotlib and Numpy to plot functional graphs in Pixel Processor?
Hi, Texture/Material Gurus.
By the help of Substance Designer's Python Editor, I'm trying to draw/plot some complex sine waves such as "Squeeze Theorem / Sandwich Theorem" shown below:
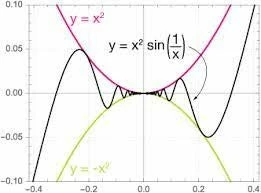
[squeeze theorem example]
I'm trying to somehow use Matplotlib in SD's Pixel Processor to plot diverse functional graphs.
But, a week-long intensive googling has failed to find a solution to import external or 3rd party Python libraries or api to Substance Designer. Its internal Python Editor keeps prompting error logs like this:
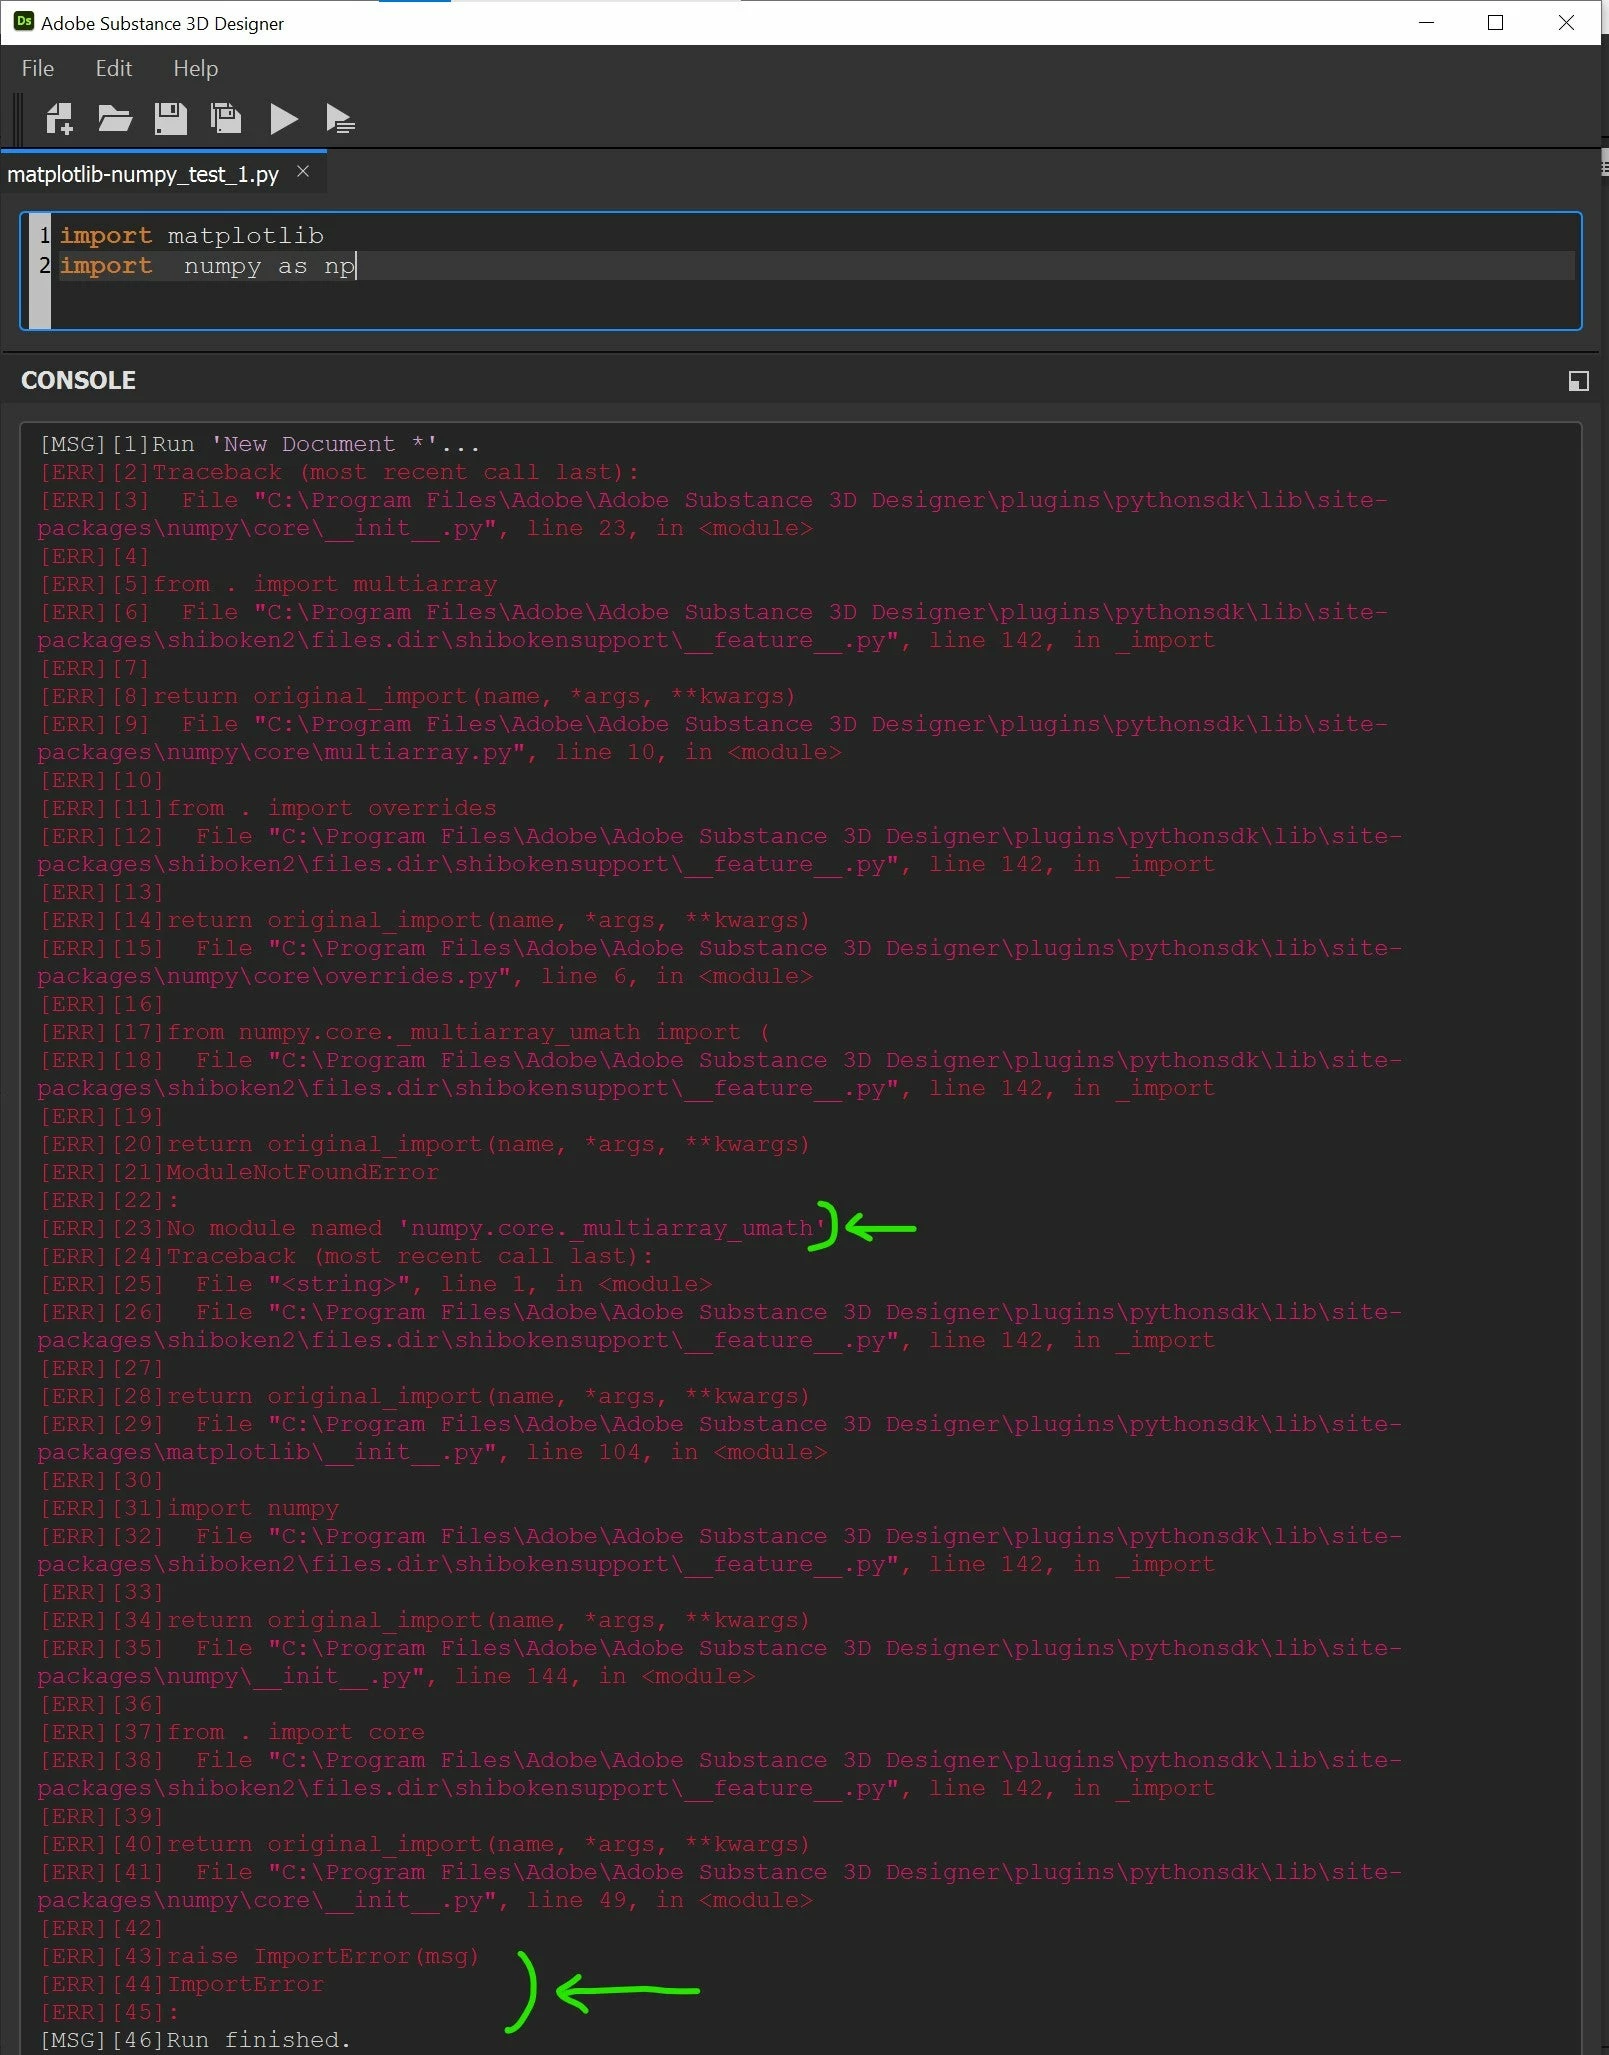
[Numpy & Matplotlib are installed in the right directory. But, Substance Designer's Python Editor can't read\/recognize Numpy??]
On my PC, I've installed all most every existing Python functional graph-drawing Libraries, such as Matplotlib, Numpy, Turtle, Tkinter, Sympy, Pysound, Graphviz, Plotly, etc. in the right directory/path recognizable for SD as a test.
But, it seems like SD doesn't read or recognize those libraries, escpecially Numpy (which, I guess, the core library for the other major graph visualizing Libraries)
Is there any way to make Substance Designer successfully import Numpy and Matplotlib?
Please save me from this cliff,
Thank you!