FFT Y-Axis scale and effect on loudness of harmonic in output
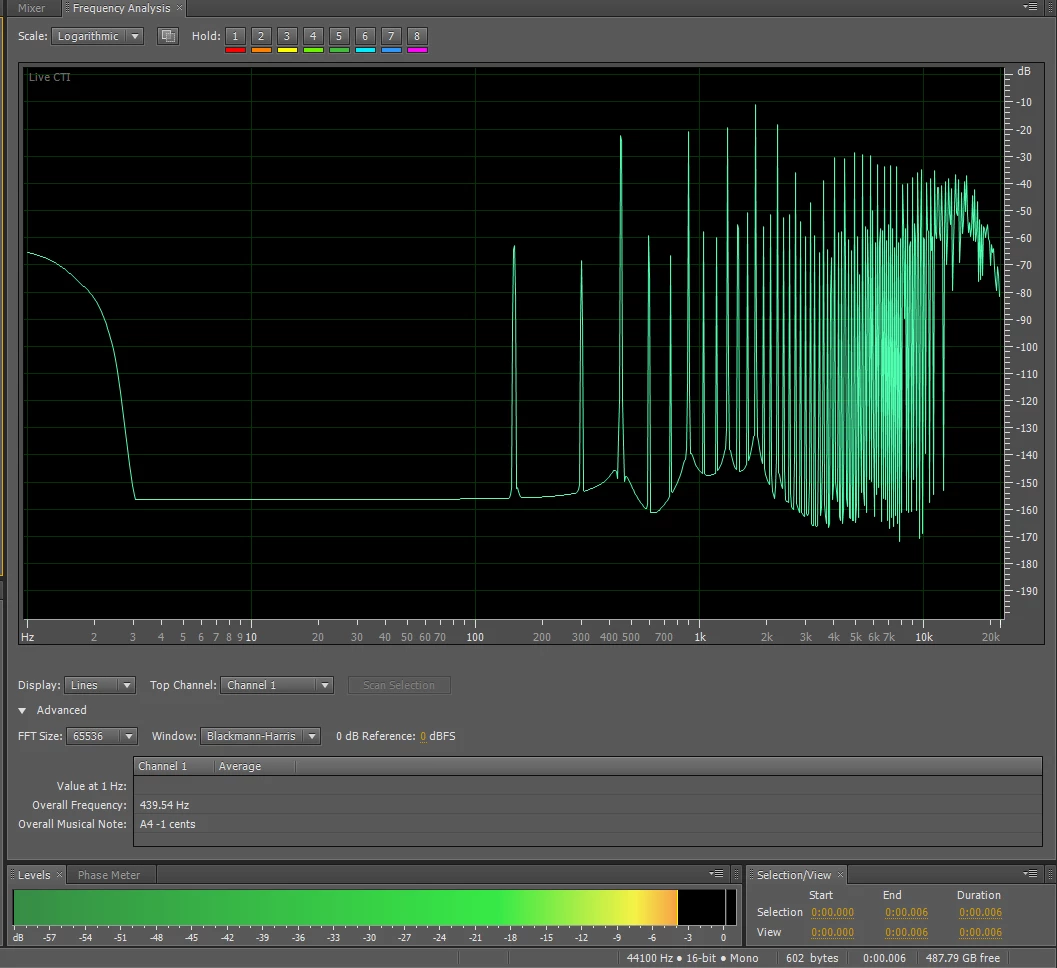
I'm working on project where I take a sample of a musical instrument tone, adjust for pitch and amplitude, then clip a representative sample that can be played seamlessly at the correct pitch. When I look at the FFT graph of the original and the FFT of the looped replay of the sample I see that the single cycle looped has extra peaks not in the original sample. The original sample has peaks at the proper frequencies for the sample. It goes down to -80db. The first peak should be about 440hz but I'm seeing additional peaks at 146hz and 292hz. 146hz is 1/3 of the fundamental and 292hz is 2x 146. Since both show up before the desired fundamental of 440hz they may be a problem. I only want the 440hz and its harmonics. The single cycle graph goes down to -160db. .
I did a quick test to see if I can figure out the extra peaks. The graph shown below actually has 3 cycles of the wave so that the pitch came in correctly when played at 44100. I did a quick edit and changed it to 2 cycles and only saw one peak about 1/2 the fundamental. When I went back to a single cycle I had no extra peaks but the pitch was up to 441 hz. My goal is to get the pitch as close as I can to 440. If the additional peaks won't be significant in the final wave then I can get within 0.5hz if they will affect the sound then I may need to go single cycle and live with the higher pitch error.
My question is related to how far down the Y-Axis scale will the peeks be so that they still add to the output sound
Are the top of the two stray peaks (up to -60db) still low enough to not show up on the output for that harmonic?
Original sample pitch corrected.
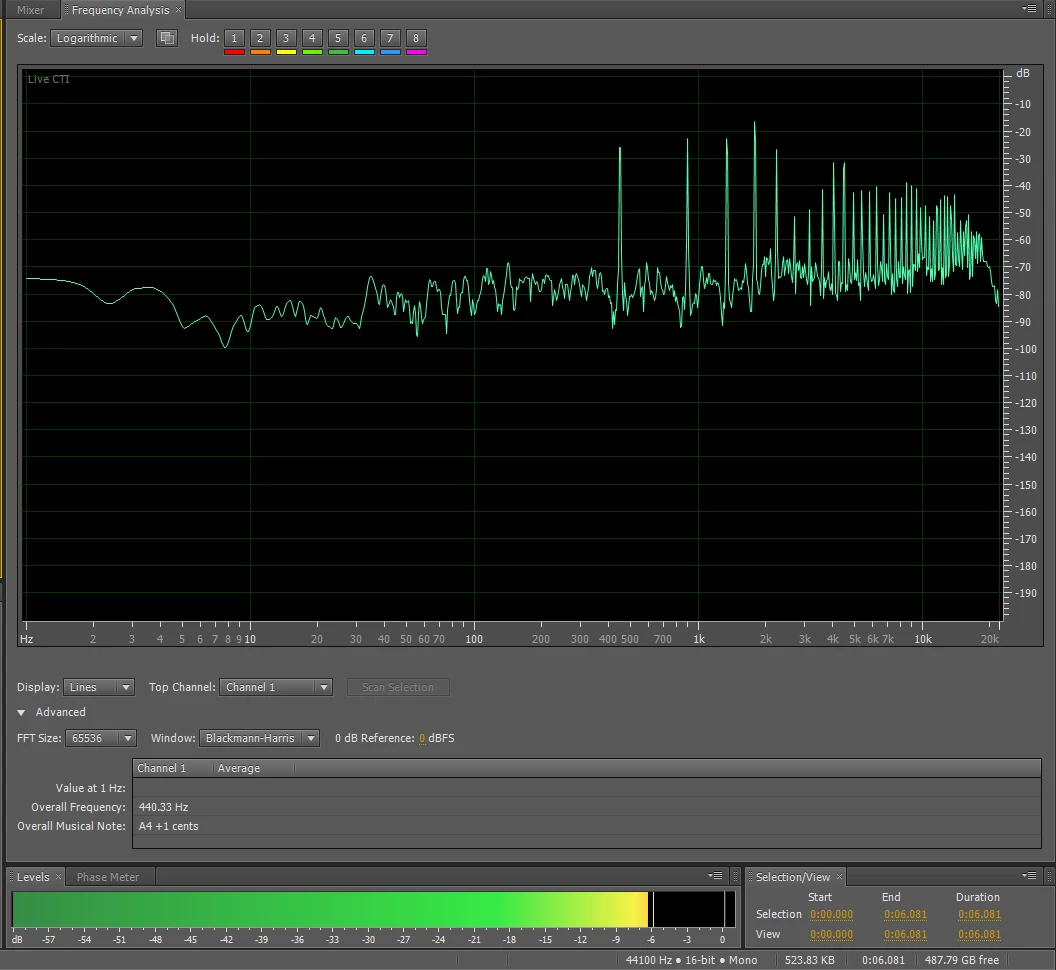
Single cycle sample played in loop mode