Participant
January 15, 2020
Question

PDF not displaying graph markers/data points when exporting from excel

  • January 15, 2020
  • 4 replies
  • 17465 views

Have been using excel to PDF to generate reports for the longest time via the >file >save as > PDF 


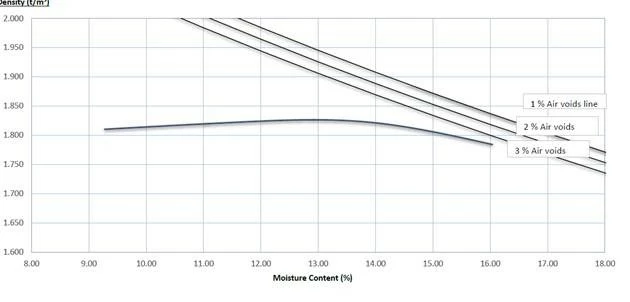
Somewhere over the past week my graph data points fail to display on the report. See image below. 


Its a requirement that i have these data points on the report. 


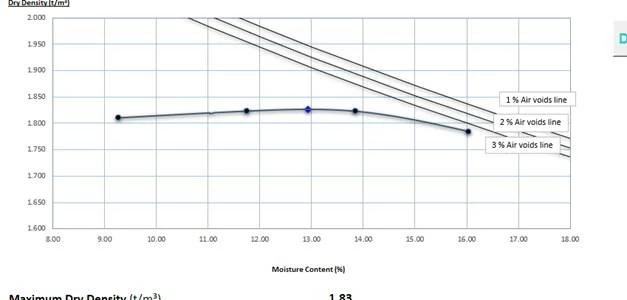
If i go file > print > microsoft print to PDF it includes these points. However does not open the PDF after each one is published which is time consuming in our industry. 


Can somebody please tell me how i can get the data points back when i save as PDF directly from excel? cheers,


This topic has been closed for replies.

4 replies

Participant
December 19, 2022

I'm also facing the same issue. when I try to export the dashboard in pdf format , graph is missing . Need help

Bevi Chagnon @ PubCom
Participating Frequently
December 20, 2022

Just tested a PowerPoint line chart in Office 365 (ver 2211 Build 15831.20208) and exported it to PDF with the Acrobat PDFMaker (PDF Maker 22 for PowerPoint, PDF Library 22.3.58) on Windows 11.


No problems. Chart exported to PDF as expected with the datapoints on the lines.


Participant
December 20, 2021

I select the part of file ( though my file is in page break preview) that i want to pdf and save as pdf. It shows all graphs. I hope it helps you.

Participant
August 25, 2020

Hi Brooke6106,
I have faced the same problem, but I just found a workaround.
First, you select the chart you like to have in PDF then print it as PDF.
So instead of Save as PDF or Export to PDF do a print and select Microsoft Print to PDF that shows all the markers on the lines.

Good luck

Participant
December 30, 2020

Hi All,


I was having this same issue trying to PDF a Word file with a Chart. In my situation, the issue was related to having shadows on the line markers. By turning off shadows on the line markers, I was able to successfully print or save to PDF with the Chart showing the line markers. Hopefully, this solution helps someone else.


Thanks!

Participant
September 24, 2021

My graphs are less stylish now but, thank you, this worked for me.

Participating Frequently
February 4, 2020

I have this same problem. Been using PPT to design reports for years and now all the data point are messed up when I convert to PDF. The data points are now scattered all over the page:


JROLAND2010
Participant
March 6, 2020

Did you find a fix? Having the same issue with a few users. 

Participating Frequently
March 6, 2020

No. Still messed up.


What I do now as a workaround is export to PDF, then export a differnt file to PNG (PNG files all look great). I delete all the messed up Adobe pages and replace them with PNGs. This kills all the links, but it is the best I can do now.