Question
Excel chart changes size when saving as PDF
I have an Excel workbook that contains several charts. When I try to export to a PDF or save as a PDF, the one of the charts is always skewed in size (seems to be whichever is selected at that time, even when I select all sheets). I use Adobe Arobat Reader DC. I have read the Microsoft support about making sure you are using a PCL printer, which I am. All charts are the same DPI. I've also unchecked the "Scale content for A4 or 8.5x11 paper sizes" box in Excel. Not sure what else to try. Any tips would be greatly appreciated!
See screenshots.
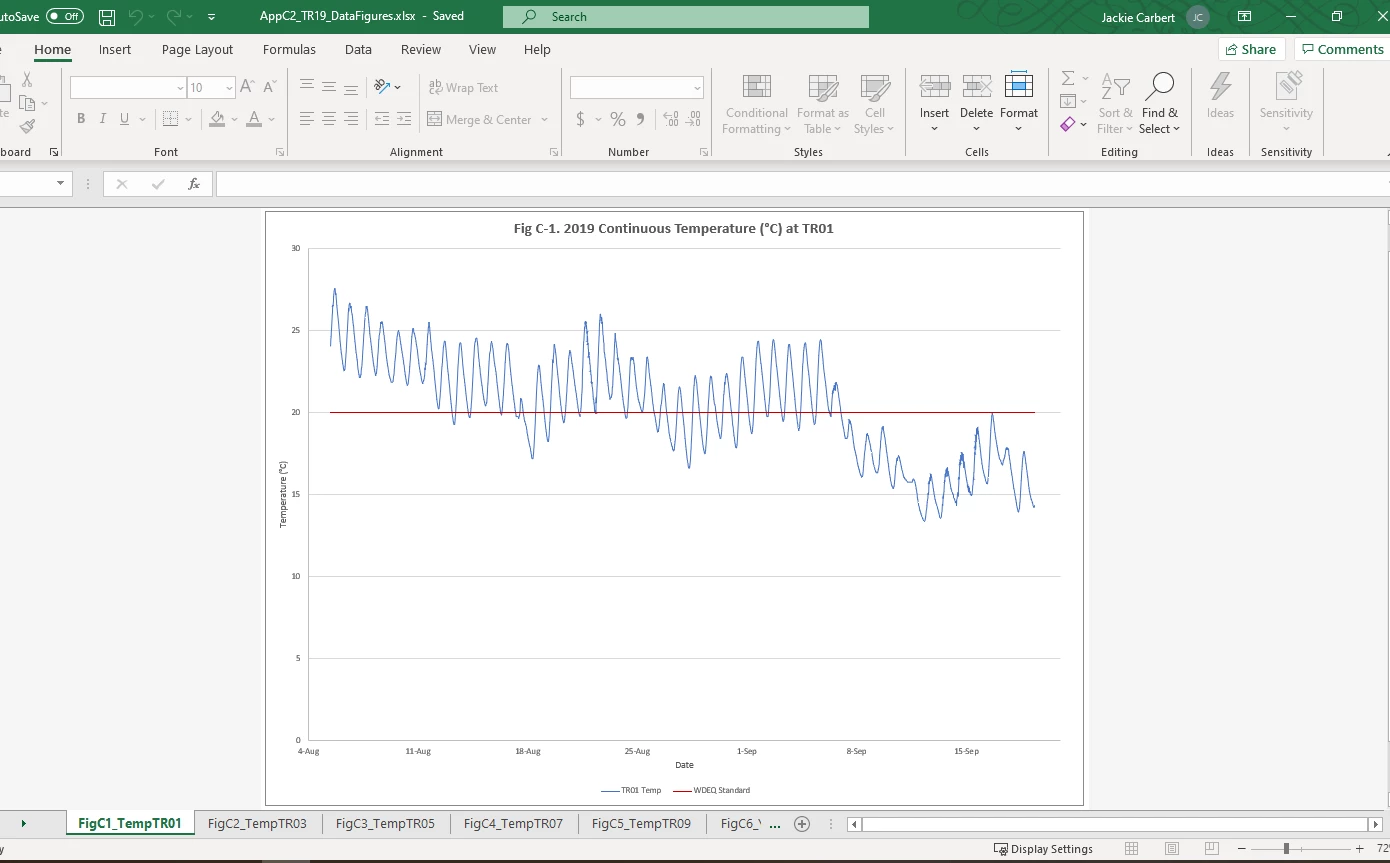
- 1st is an example of one of the charts in Excel
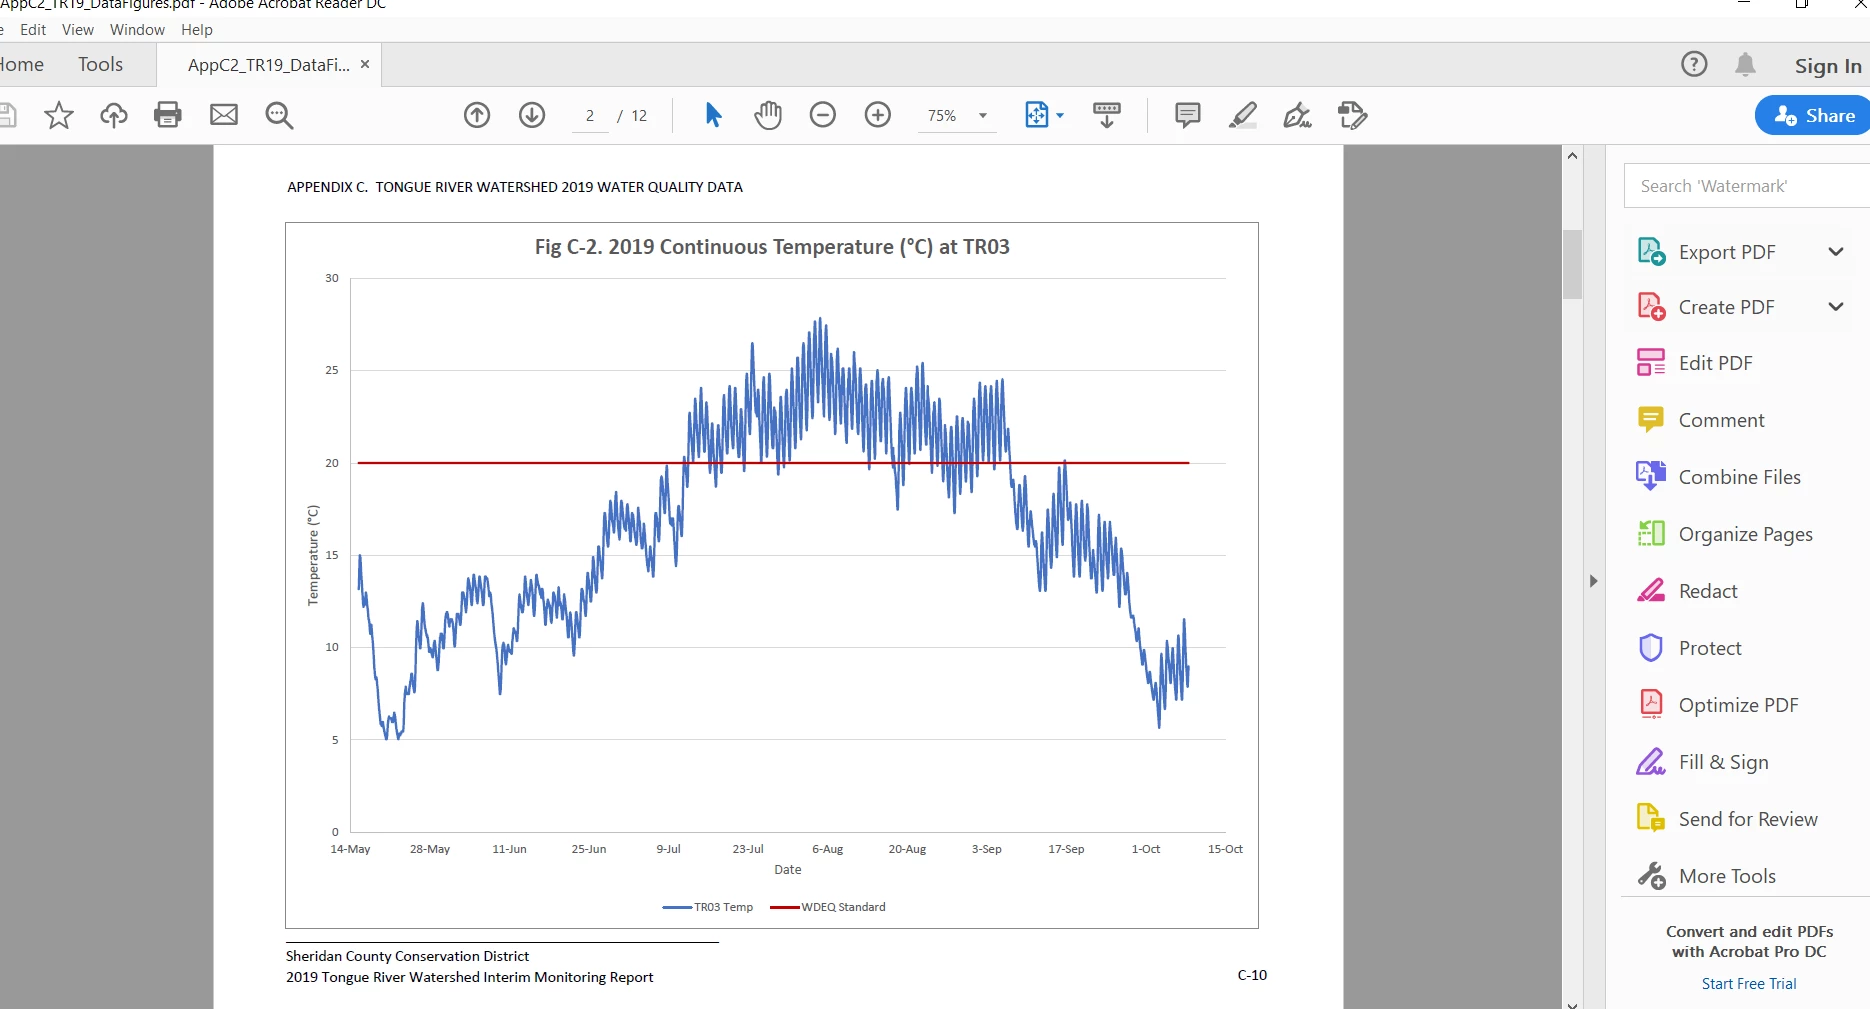
- 2nd is how the rest of the charts look in the PDF, like they should, the correct size.
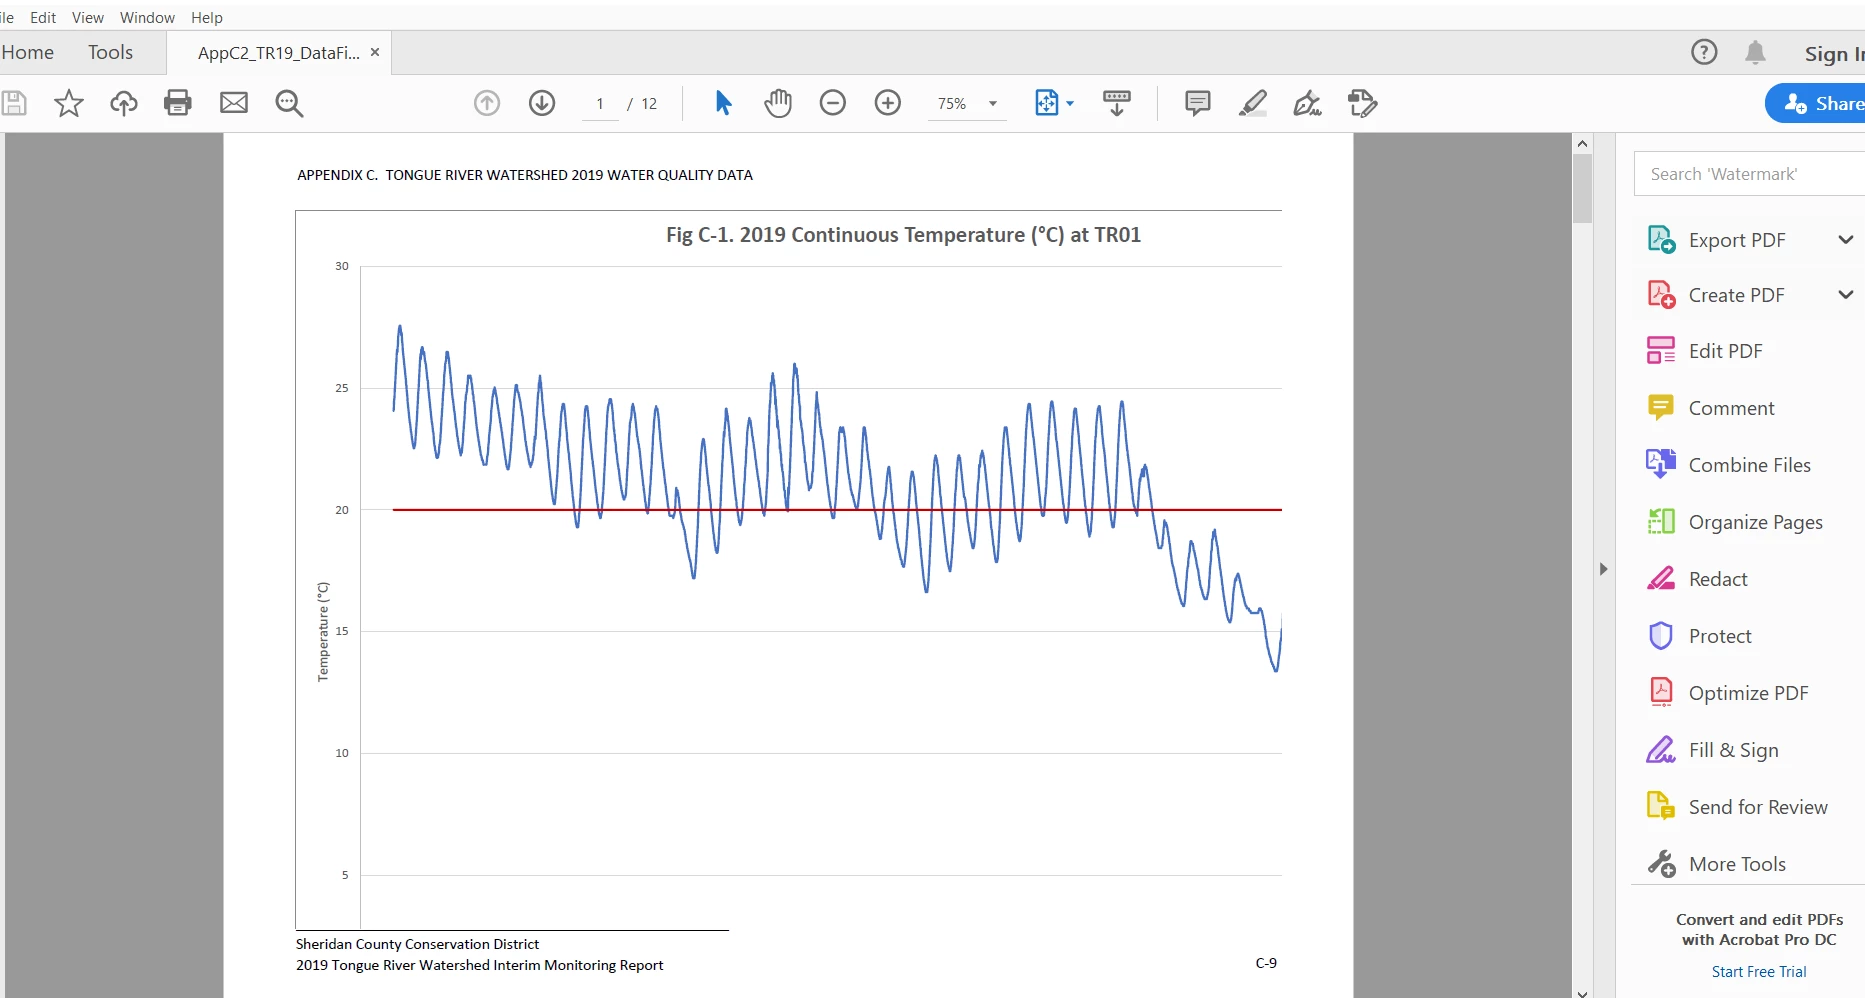
- 3rd is the issue I'm experiencing with the first chart when exporting/saving to PDF. It essentially zooms in on the chart, cutting off the x axis, titles, units, etc.