
Answered
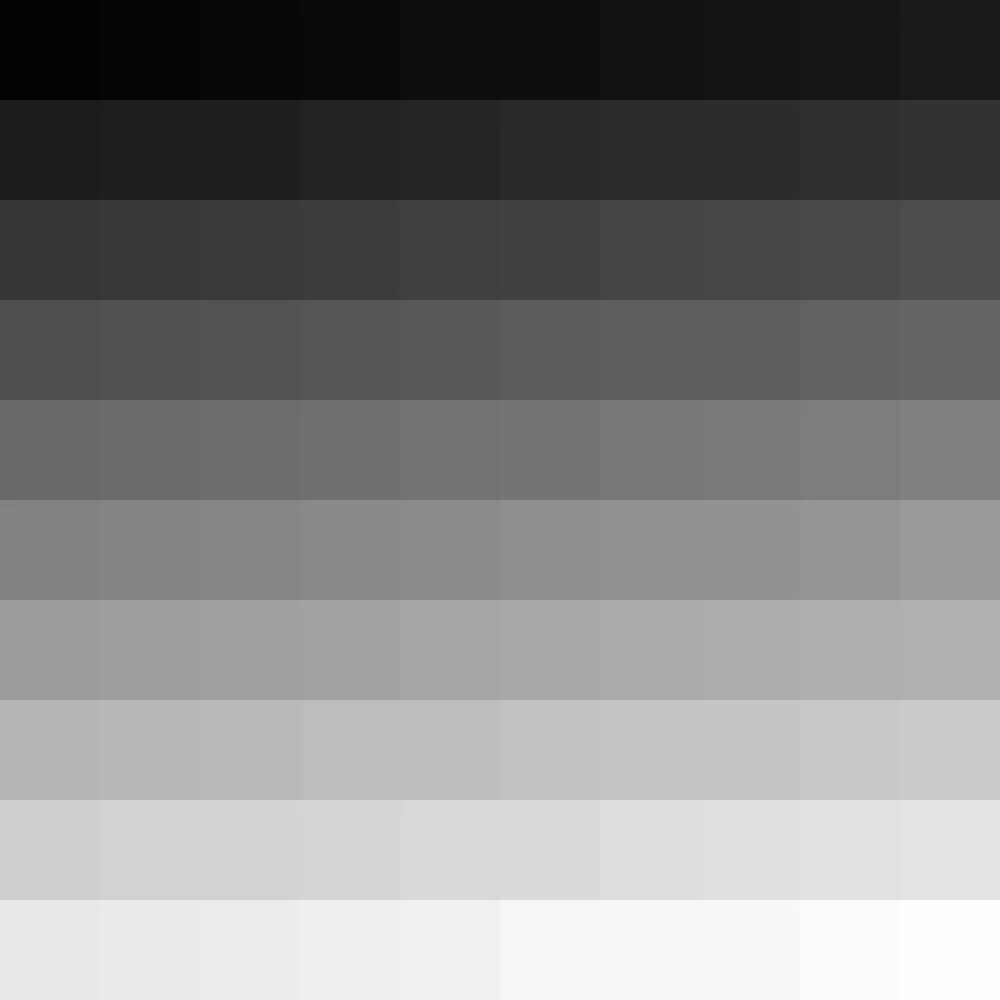
Create a grayscale table chart in illustrator
I have 10x10 rectangles, I want to fill all selected items gradually from exact 0 to 1 lightness values.
I tried to write this one below but it doesn't really clamp for the blackest point. (RGB values still show as 3,3,3) What am I missing? And also there should be an easier solution for it.
// Fill all selected items with gradually from black to white
var doc = app.activeDocument;
var rgbCol = new RGBColor();
var col = [];

doc.defaultFillColor = rgbCol;
var hslColor = [];
var hue = hslColor.push(hue);
var saturation = hslColor.push(saturation);
var lightness = hslColor.push(lightness);
var selectedCount = app.selection.length;

function hslToRgb(h, s, l) {
  var r, g, b;
  if (s == 0) {
    r = g = b = l; // achromatic
  } else {
    function hue2rgb(p, q, t) {
      if (t < 0) t += 1;
      if (t > 1) t -= 1;
      if (t < 1/6) return p + (q - p) * 6 * t;
      if (t < 1/2) return q;
      if (t < 2/3) return p + (q - p) * (2/3 - t) * 6;
      return p;
    }
    var q = l < 0.5 ? l * (1 + s) : l + s - l * s;
    var p = 2 * l - q;
    r = hue2rgb(p, q, h + 1/3);
    g = hue2rgb(p, q, h);
    b = hue2rgb(p, q, h - 1/3);
  }

  return [ r * 255, g * 255, b * 255 ];
}

function clamp(num, min, max) {
  return num <= min ? min : num >= max ? max : num;
}

function main() {

     for (var a=0; a<selectedCount; a++)
     {

              hslColor[0] = 0;
              hslColor[1] = 0;
              value =  (100 - (a * (100/selectedCount)))/100;
              hslColor[2] = clamp(value,0.0,1.0);
              //alert (hslColor[2]);
              col = hslToRgb(hslColor[0],hslColor[1],hslColor[2]);
              rgbCol.red = col[0];
              rgbCol.green = col[1];
              rgbCol.blue = col[2];
              app.selection[a].filled = true;
              app.selection[a].fillColor =rgbCol;
     }
}
main();