

CEP panel Questions: 1) Is Chrome necessary for debugging or can Edge (a chromium work)? 2) ...more
Hello,
I reached this point:
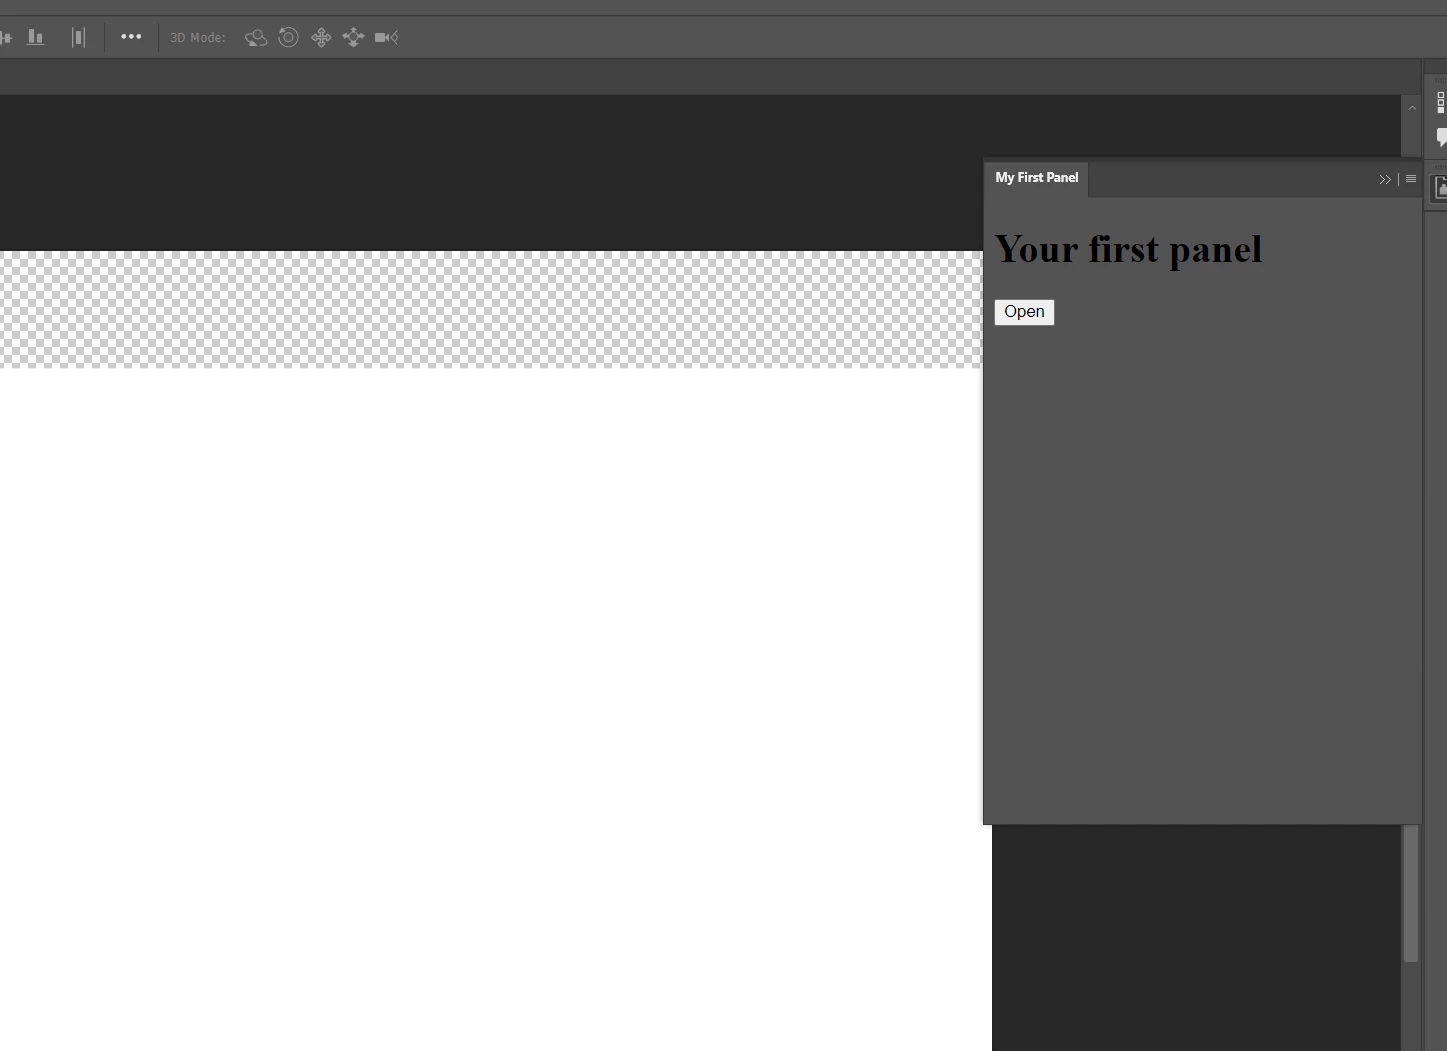
The buttons works but the debuggins page does not seem to work.
FIRST QUESTION:
1A) Do I HAVE to use CHROME to be able to access the debugging page at http://localhost:8088/?
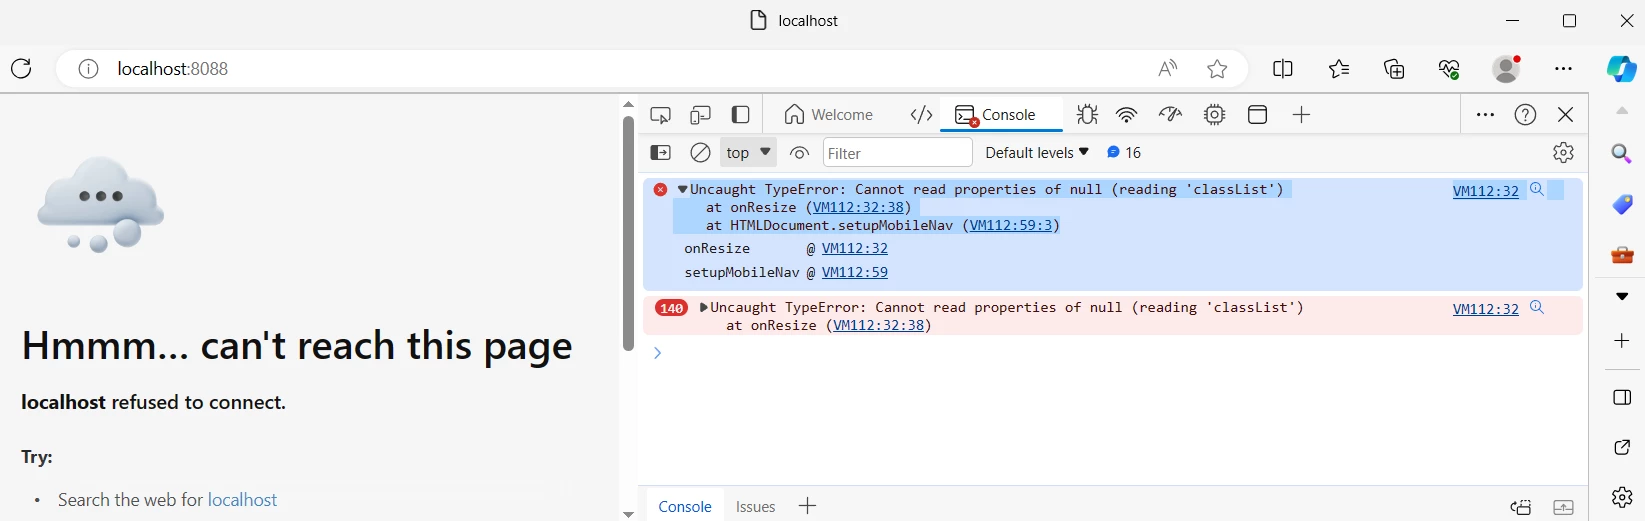
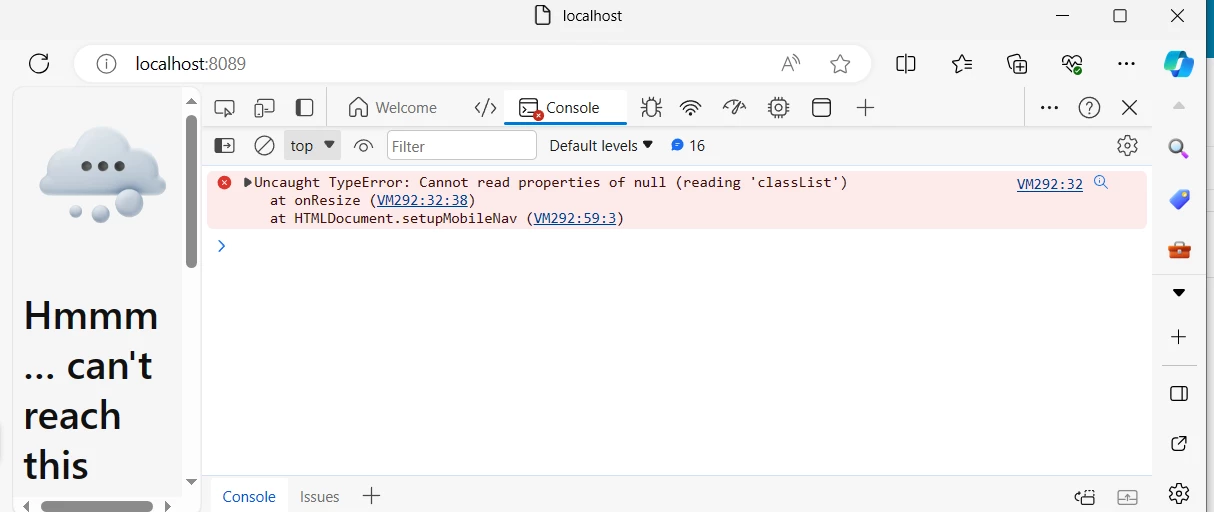
I tried on Edge, and I am not getting anything from the upload image cep example, it shows this error/problem:
-----------------------------------------------------------------------------------------------------------------------------
| onResize | @ | VM112:32 | |
| setupMobileNav | @ | VM112:59 |
------------------------------------------------------------------------------------------------------------------------------
Screenshot, this is on the browser EDGE:
1B) Is there a problem particular here?
Yes I have added in the .debug entry otherwise the panel would not show up at all:
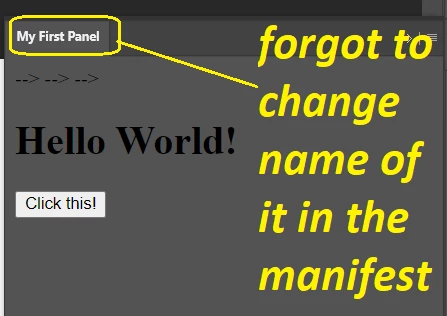
I tried with another index.html (but I kept = all other files from the "upload image" example, as they are)
=> new index:
<html>
<head>
    <title>Hello World!</title>
</head>
<body>

    <h1>Hello World!</h1>

    <!-- Add a button labeled “Click this!” -->
    <button id="myButton">Click this!</button>

    <script type="text/javascript">
    /* Add a click handler to the button */
    document.getElementById('myButton')
        .addEventListener('click', function() {
            /* When the button is clicked, output a string to the JavaScript Console */
            console.log("I can't believe you clicked!");
        });
    </script>

</body>
</html>
Still nothing in the debugging page of EDGE browser (I changed it to 8089) despite clicking on that button and changing the index file:
Second point:
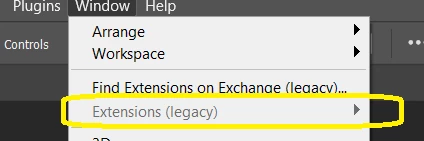
I am trying to understand how to make the extensions work in specific version vs "common files":
The panel seems to have showed up when added here: "..\Common Files\Adobe\CEP\extensions"
But when I tried to put it here:
C:\Users\Name with Spaces\AppData\Roaming\Adobe\Premiere Pro\23.0\UXP\PluginsStorage\Internal
=> nothing showed up!
How comes?
IS that expected behaviour?
Third point:
Despite having "Photoshop 2024" :
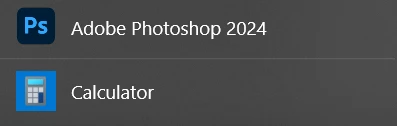
I chose the value 25 Because of:
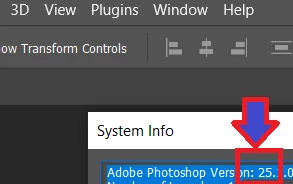
<Host Name="PHSP" Version="25" />
<Host Name="PHXS" Version="25" />
Am I on the right path ?
Is that the general rule to follow when writing these lines for the rest of the adobe products? (alwayws open HELP-> SYSTEM INFO -> And take that version for the manifest?
Fourth point:
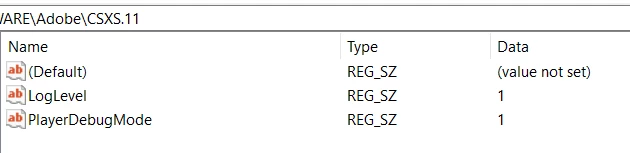
Is CSXS v = 11.0 the very last one?
-----------------
What else should I know?
I really don't want to install chrome, can I get the debugging working with another premium than Chrome please?