Exit
  • Global community
    • Language:
      • Deutsch
      • English
      • Español
      • Français
      • Português
  • 日本語コミュニティ
  • 한국 커뮤니티
0

What's happening? I could not run ExtendScript anymore????

Engaged ,
Aug 11, 2025 Aug 11, 2025

Hello

Here is a very simple script:

$.writeln("aaa");

var aFile = new File($.fileName).parent.fsName + "/aaa.wav";
var jsx = proj.importFiles([aFile]);

$.writeln("aaa2");

var startTime = new Date();
$.writeln("aa3");
 
I am running it, but nothing is happening? It was working yesterday:
Screenshots:
Bed30321077z973_0-1754974781084.png


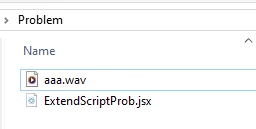
The folder where visual code is open:

Bed30321077z973_1-1754974835148.png


You can see the file is there.

And finally PPRO right after running the code (and seeing no prints for the first time it happen to me)

nothing happened:
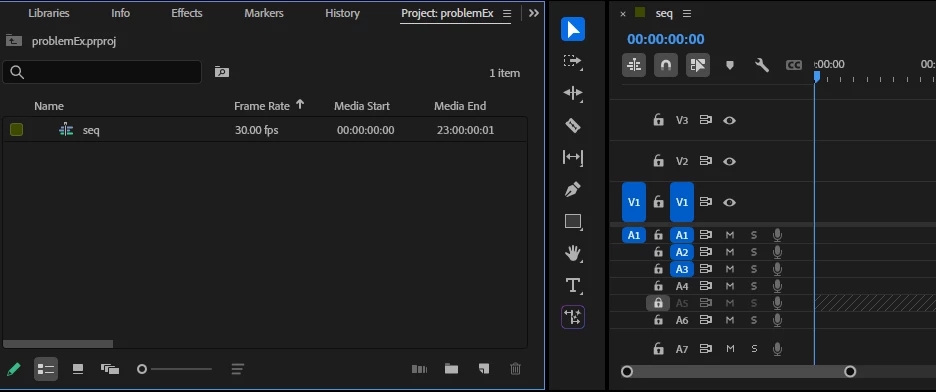
Bed30321077z973_2-1754974888648.png


Please tell me what is wrong!


At visual code level I see the usual eval, but only for a split second then it disapears and as i said nothing happened, no prints inside terminal/debug console (from $.writeln() lines) and no effect on current opened ppro project:

Bed30321077z973_0-1754975164135.png

(This dissapears in seconds)


I need PPRO scripting thought ExtendScript, I have been working on this workflow for 1-2 years (you might recognize my name from last year), everything was working fine up to today.


Is there a problem?

 (Only thing I did was to save AS (new name) a current project on PPRO while visual code was open, but again I restarted ppro and visual code several times, even restarted pc)
 
TOPICS
SDK
361
Translate
Report
Community guidelines
Be kind and respectful, give credit to the original source of content, and search for duplicates before posting. Learn more
community guidelines

correct answers 1 Correct answer

Adobe Employee , Aug 12, 2025 Aug 12, 2025

>I am not used to seeing these blue buttons.

From the screenshots you've it appears that your current VSCode project contains no debugging configurations; this would prevent successful debugging. Are you attempting to execute your local .jsx from within a different directory, than the one from within which it previously worked? 

You're not making any QE DOM calls, so app.enableQE() doesn't do anything, nor does it use the active sequence, so I'm not sure why they'd be relevant...

Do you have the la

...
Translate
Adobe Employee ,
Aug 12, 2025 Aug 12, 2025

>...everything was working fine up to today.

What, in your development environment, changed between today, and the last time you were able to launch and debug ExtendScript in PPro?

Translate
Report
Community guidelines
Be kind and respectful, give credit to the original source of content, and search for duplicates before posting. Learn more
community guidelines
Engaged ,
Aug 12, 2025 Aug 12, 2025

Hello @Bruce Bullis I am glad you are here in august maybe we can resolve this quickly.

To answer your question: almost nothing. The only thing that happened was that:

1) I opened my PPRO project, that had responded well to visual code.

2) I opened my Visual code with extend script that was working fine the day before and interacted well with PPRO (mostly sending commands such as importing files etc)

3) THIS TIME: I did a "Save As" , and the project changed name. Then I deleted some imported items to retry the import (I am doing lot of experiments with that). Just before running my code again.


I am wondering if when Visual code was set up, it had "connected or registered" a specific PPRO project opened, and the SAVE AS, somehow disturbed the connection or something like that.

I went back to all my previous projects that worked this week and week before: none response to the code I shared anymore.

When I run the code and select extendcode (start debugging -> Launch--> PPRO), it shows that blue "Eval" icon for a split second then stops, and it shows this  on the left:


Bed30321077z973_1-1755016668735.png


I am not used to seeing these blue buttons.

usually the EVAL blue icon or even blue line at the bottom STAYS and a button to HALT the run is available.

Well not this time, it just stops within splits of seconds and none of the code was/is run, since no print appears in no terminal nor debug console.

Are there some logs we can look at or anything we could do?


NOTICE THAT: I don't get an error when selecting debbuging -->... --> PPRO. (I would get an error if I select "Adobe media Encoder" since it is not open). But yeah PPRO is open and no error happen, but also the code is not run anyway so that's weird? (I just tested, I closed PPRO and run the code and the error saying it is not open shows up correctly).


What can we do?

Thanks


Translate
Report
Community guidelines
Be kind and respectful, give credit to the original source of content, and search for duplicates before posting. Learn more
community guidelines
Engaged ,
Aug 12, 2025 Aug 12, 2025

OK I modified the code (it was a code i made to show the problem I had but I had forgotten some important initiations), here it is:

app.enableQE();
var proj = app.project;

var activSeq = proj.activeSequence;

$.writeln("aaa");

var aFile = new File($.fileName).parent.fsName + "/aaa.wav";
var jsx = proj.importFiles([aFile]);

$.writeln("aaa2");

var startTime = new Date();
$.writeln("aa3");

Now the Eval bar shows up:

Bed30321077z973_0-1755018553079.png


(It no longer shows up actually, after few experiments bewteen writing this and trying to reproduce)

Even when the blue bar showed up (meaning the code was still running), no print showed up on output or debug console or anywhere, and no file was imported to the project!!

Translate
Report
Community guidelines
Be kind and respectful, give credit to the original source of content, and search for duplicates before posting. Learn more
community guidelines
Engaged ,
Aug 12, 2025 Aug 12, 2025

So @Bruce Bullis ? problem still persisting 😞

Translate
Report
Community guidelines
Be kind and respectful, give credit to the original source of content, and search for duplicates before posting. Learn more
community guidelines
Adobe Employee ,
Aug 12, 2025 Aug 12, 2025

>I am not used to seeing these blue buttons.

From the screenshots you've it appears that your current VSCode project contains no debugging configurations; this would prevent successful debugging. Are you attempting to execute your local .jsx from within a different directory, than the one from within which it previously worked? 

You're not making any QE DOM calls, so app.enableQE() doesn't do anything, nor does it use the active sequence, so I'm not sure why they'd be relevant...

Do you have the latest ExtendScript debugger installed? If so, you can use VSCode's "Run --> Add Configuration..." to add one. 

Here's my local "Run a script named test.jsx, in PPro beta" configuration:

{
"type": "extendscript-debug",
"request": "launch",
"name": "Beta",
"hostAppSpecifier": "premiereprobeta-25.0",
"script": "~/estk/test.jsx",
},


I open my "~/estk" directory in VSCode, select the Debug button (from the left edge of the VSCode screen), then "Run --> Start Debugging". 

 
Translate
Report
Community guidelines
Be kind and respectful, give credit to the original source of content, and search for duplicates before posting. Learn more
community guidelines
Engaged ,
Aug 12, 2025 Aug 12, 2025

Hello Again,

1) ""Are you attempting to execute your local .jsx from within a different directory, than the one from within which it previously worked? ""

I have more than a dozen directories where I run copies of the code that I modify from time to time to experiment.

I simply create a folder, copy a code that has been working for in the past, then copy the path to the current directory, go to visual code, I click on File --> Open Folder.. and I find quickly the previous directory by pasting it on the path bar , I confirm.

Visual Code embedded with latest ExtendScript never asked me anything, or any detail about a config file, and for more than a year or usage. (with some pauses but the points it It used to be like that in the past for me, and still was until yesterday, no config whatsoever)


I opened my previous working directories and Checked and none had the hidden file ".vscode" (except the last one where you recommanded to create the config file)


So all of that to say that I never had to created any config file, nor did it show up on my directories (where ES worked file always).


But your point makes me think, I might have clicked quickly on some button that deleted some hidden config perhaps? 

Can a config or similar be removed and user not realizing because it was hidden? I mean are there other hidden config embedded somehow but not shown on any ".vscode"

(As you have guessed, I have activated display of hidden files, and none of directories had ".vscode" that would contain a config, nor any config file anywhere) So I am trying to find/investigate if there are other hidden config that do not show up and that I might have removed without knowing? So we can solve this issue when it happen again, and of course prevent it from happening again.


2) - Yes sorry, you are right the QE DOM is a relic from past experiments, it was not even used on my other scripts that much.


3) So I tried to make the config file like you suggested:

First one suggested when i click run -> add config was:

{
    // Use IntelliSense to learn about possible attributes.
    // Hover to view descriptions of existing attributes.
    // For more information, visit: https://go.microsoft.com/fwlink/?linkid=830387
    "version": "0.2.0",
    "configurations": [
        {
            "type": "extendscript-debug",
            "request": "attach",
            "name": "Attach to ExtendScript Engine"
        },
        {
            "type": "extendscript-debug",
            "request": "launch",
            "name": "Launch Script in ExtendScript Engine"
        }
    ]
// }


I tried to replace it with yours like this:

{
"type": "extendscript-debug",
"request": "launch",
"name": "Beta",
"hostAppSpecifier": "premiereprobeta-25.0",
"script": "~/PROBLEM/ExtendScriptProb.jsx",
}

Even replaced premiereprobeta-25.0 with premierepro-25.0 since I am not using beta. (I am in build 85 if thats helpful)

Both did not make run -> launch -> ppro run.

How does this config thign work considering I never use it? is it important and useful? Since my stuff works I am enclined to ignore it for now, but I am open to suggestions.


4) I finally decided a new thing:

I opened a windows user account that had no ppro in it.

Installed visual code and opened PPRO (which works on all users apparently, perhaps installed in system wide) YES I am on windows.

Copied the code and the aaa file to a folder, and opened it with VC, run the code and it worked!

My firstt instinct now is to uninstall PPRo and reinstall it on the other user account.

Until I started writing these lines I had another idea:

I copied the code and the aaa file to another directory and IT WORKED.

What's interesting for would be to think that the problem directory I had (on my screenshot) is actually located in a long path: sometthing like that:

D:\xxxxxxxxxxxxxxxxc\xxx\xxxxxx\xxwxxxhxxxxxxxxxxxxxxxxxixgxxxx&xxxxxxxxx\xxxxxxxxxx\Pxoblxm


But I remember having the error start from the parent folder to the "problem" folder  ("Pxoblxm" on that path)

maybe it is not the length of the path more like the presence of "&" on the path (parent of the parent is "xxwxxxhxxxxxxxxxxxxxxxxxixgxxxx&xxxxxxxxx" notice the &)

mayeb thats just that.

or maybe the path was already too long before the problem directory already.

Translate
Report
Community guidelines
Be kind and respectful, give credit to the original source of content, and search for duplicates before posting. Learn more
community guidelines
Adobe Employee ,
Aug 12, 2025 Aug 12, 2025

> So all of that to say that I never had to created any config file, nor did it show up on my directories (where ES worked file always).


Given that, I have no idea how ExtendScript debugging has ever worked on your system. 🙂 VSCode debugging requires the presence of a launch.json file, within a (hidden) .vscode directory.

I'm glad you found a working solution.

Translate
Report
Community guidelines
Be kind and respectful, give credit to the original source of content, and search for duplicates before posting. Learn more
community guidelines
Engaged ,
Aug 12, 2025 Aug 12, 2025
LATEST

Yes I just copied my code to another directory and it worked (my actual script not the example), and... yeap there is no config file there lol. No hidden vscode subdirectory nothin:) And it has ALWAYS been like that (Please do NOT change it lol, No need to fix something working, you can explore it yourself though, you open a directory, put into it a jsx example code, go to VS File -> open folder -> choose the directory where the jsx is, RUn -> start debugging -> launch -> ppro. And it will run and no .vscode was ever needed, And I am glad it works and wish it stays like that)


So what do you think about the path length, that could have been the problem you think, or was it the "&" ? I will try again with another .. Nevermind I have the answer:

It seems having "&" on the path prevent extendscript from running! Solved.

Translate
Report
Community guidelines
Be kind and respectful, give credit to the original source of content, and search for duplicates before posting. Learn more
community guidelines