Inspiring
January 24, 2018

P: Histogram behaviors are different from prior versions

  • January 24, 2018
  • 104 replies
  • 3328 views

I am experiencing problems with the histogram in 19.1.0. I am a mid-career fine art photographer by profession, and have been a PS user since Version 2. I am also a member of the Authors Guild, and write on photography for various publications. I have been purposely hanging back at PS 2015.5.1, as it has served me well. Yesterday, I decided enough, is enough, and installed 19.1.0.

This first histogram is at Cache Level 1 for the file values of a 36Kx24K pixel 16-bit grayscale file.


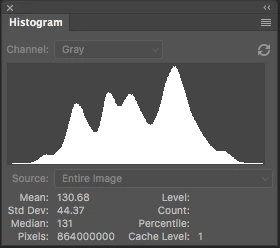
Please notice how there are "tails" (lines) out each side of the main body of data, indicating that there are small levels of data almost to the limits of range. For me, it is important to know about these tails exist so that I do not end up creating a clipped condition when applying a curve function. We use S-curve limiters to compact the tails without clipping.

Here is the exact same file at Cache Level 1 for the same 36Kx24K pixel 16-bit grayscale file, but this time in 19.1.0.


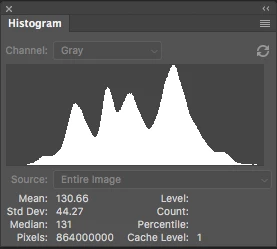
Please notice how there is no tail indicating data extending to the left, and rather a botched one going to the right. This is not helpful! You will also notice that the Mean and Standard Deviation values differ.

Further, it use to be nice to be able to take the cursor and scan across the histogram with a display of level and count showing up for whatever was under he cursor. This seems to have gone away in 2015.5, and is even worse in 19.1.0.

Thanks for your help.

Pete

This topic has been closed for replies.

104 replies

Todd Shaner
Legend
May 8, 2020
1) What's causing the "missing" histogram tails on your systems remains to be determined and what I was trying to focus on. Unfortunately this post ths become very fragmented with numerous posts concerning other issues, suggestions and observations on how to "improve" the histogram.

2) The intercept line issue has been entered in a separate post and acknowledged by Adobe with status of 'In Progress.' 

3) Disappearing histogram SOLVED. Now let's focus on the "missing tails" issue.

https://feedback.photoshop.com/photoshop_family/topics/intersection-line-in-curves-not-working
Todd Shaner
Legend
May 8, 2020
Ron, the tail extension in the resized 1024 width image file is most likely due to Bicubic interpolation ringing artifacts. Lacking any other evidence the histogram is most likely correctly displaying these artifacts.

https://en.wikipedia.org/wiki/Bicubic_interpolation#Use_in_computer_graphics
Inspiring
May 8, 2020
Jeff/Todd,
I would like to share my recommendations on how to make histograms more usable.  If yes, let me know. 
RONC 
Inspiring
May 8, 2020
Hi Jeff:

Thanks for your interest there at Adobe. I hope I have provided enough information to understand the two remaining issues---the intercept line and the histogram tails. If I can be of further help, please search for me via Google, and be in touch direct.

Else, signing clear.

Pete Myers
Santa Fe
Inspiring
May 8, 2020
Hi Todd:

I don't participate in the Adobe forums very often. Are you the moderator of this forum or a participant? I am not sure what "champion" is, so forgive my asking.

Pete
Inspiring
May 8, 2020
I'd ask how many Adobe executives can really use Photoshop or other programs.  Most companies are weighted toward sales types and bean counters at the top.   Enough.

RONC
Inspiring
May 8, 2020
Correction: there were three issues interrelated, and my other post got merged to this one, so I would assume that we will be addressing all three in this thread. One is resolved:

1) The Histogram tails not showing, which for me has been an issue with every version of PS past 2015.5. Note: two different computer systems and OS to go with that, so I doubt it is as simple as an OS problem. However, as Ron has demonstrated, there seem to be hidden setup items in PS that I may have missed post 2015.5. The histogram tails issue is not a new problem for me, but an ongoing conundrum.

Also, you are showing me tails, but those tails need to match the data. I cannot tell from the histograms posted alone if you are showing data from Level 1 at a Count of 10, to Level 246 at a Count of 01 on Jeff's photo. You asked to match data on a known photo, but the histogram is not the whole story---so please include the data.

And is that Windows or Mac OS? Which version and which PS version are you using Todd?

2) The intercept line is missing from the curves function.

3) RESOLVED: the histogram function disappearing on touching the curves function (or any other function).

So let us not forget the intercept line as it too is an important part of the Curves function.

Pete

PS Sorry for the breakout into other issues related, but darn if there isnt a lot left hanging! How many posts do we have to make to have some forward focus on the broad issue of improving the histogram and curves function for use in the 21st Century? And in my thinking, having these other issues come up is directly linked to Adobe not keeping their eyes on the fries. I think that is exactly what Ron was trying to say as well---am I correct Ron? It IS related.
Inspiring
May 7, 2020
First off, I apologize for going off tangent.  I need an attitude adjustment and hope it is coming soon..

Attached is a display of histograms from Jeff's image the left is from full size and the right from a about 1/3 size version.  Notice the difference in the tails and I can't guarantee there aren't ones still missing.  I think allowing the histogram to be physically larger should help but there needs to be special treatment so that a bin of count 1 is fully visible. 

I'm going to try a couple things with a plugin I have.  Usually the bottom level is only half the interval so rounding up needs to be done.  Artificially add one to non-zero bin could help.  Problem is the maximum bin is setting the criteria.  Non-linear (log) display is often used to show a different view but it will have the same problem with very large images.


Width of input to histogram is 3014 vs 1024 and height scaled likewise.  

RONC
Todd Shaner
Legend
May 7, 2020
"I see some "tails" to either side but I don't know whether I'm seeing what I should. I see different from what Pete is seeing."

That's the issue. On Pete's system the tails are not visible at all, which obviously isn't correct! Pete can you please download Ronald's test file and show us the histogram?

 https://www.dropbox.com/s/3h02hzeyw2xsara/grayFlat512gray16.tif?dl=0

As per my analysis using your scientific test image file it appears to be correctly showing the relative levels within the constraint of the small histogram palette. If I were to request a change it would be to offer an option to allow the user to resize the histogram palette to make it larger.
Inspiring
May 7, 2020
I see some "tails" to either side but I don't know whether I'm seeing what I should. I see different from what Pete is seeing. Again you have to use some image where you know what is supposed to be there.
RONC