

Question
Expression error: "couldn't turn result in numeric value" (Working with a CSV file)
I'm trying to create a graph with multiple lines based on a CSV file with different columns of data.
Two columns in particular have values that go above 1000000 and I think here is the problem.
Because the other columns don't give me any problem and I can create a line for each of those.
When I do the same process for the columns with values with values over 1000000, I receive this error.
I will upload an image of the spreadsheet, of the expression and the sliders that I'm using.
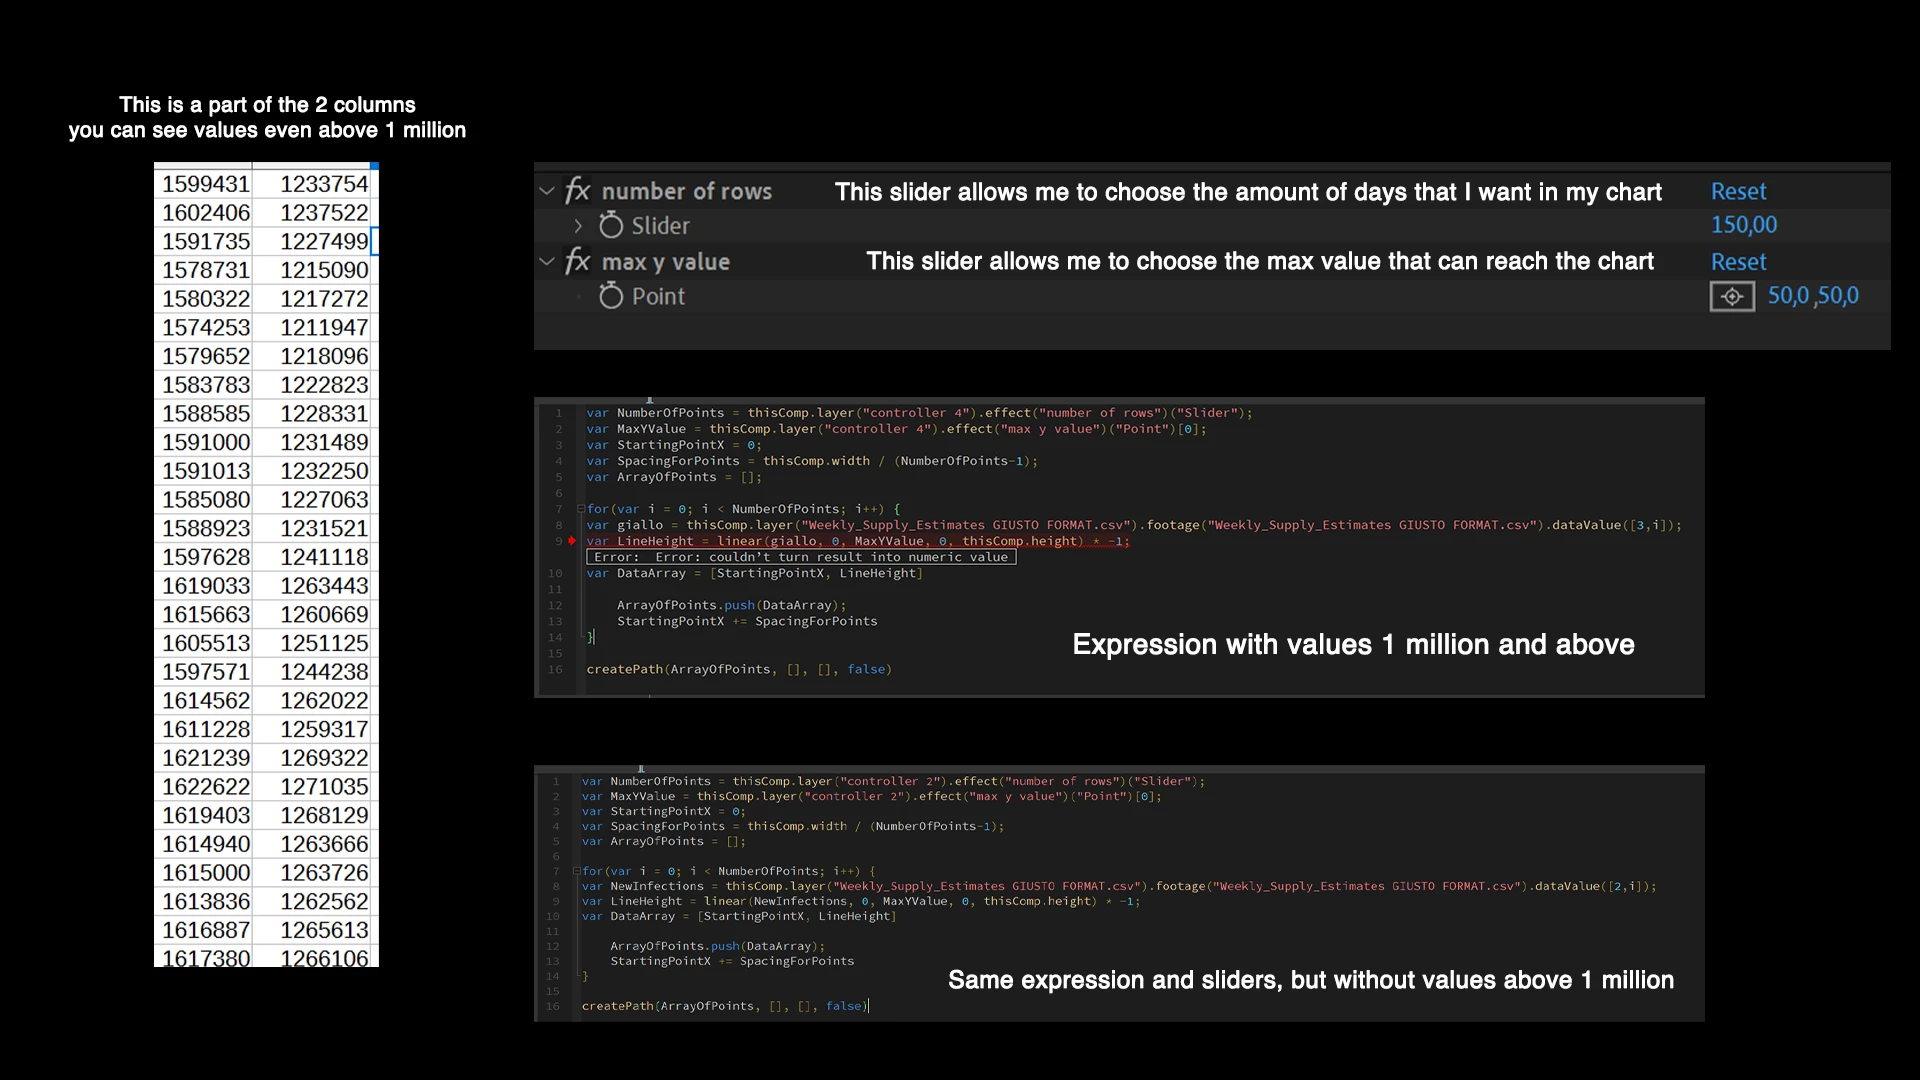
You may ask "Why do you use a point control instead of a slider control for the Y values?"
Because only the point control can reach values above 1 million, however this doesn't seem to work, I don't know where is the problem.