grefel
Adobe Expert
November 20, 2018
Answered

Extendscript Toolkit debugger fails on Mac: Can't start debug session

  • November 20, 2018
  • 15 replies
  • 23546 views

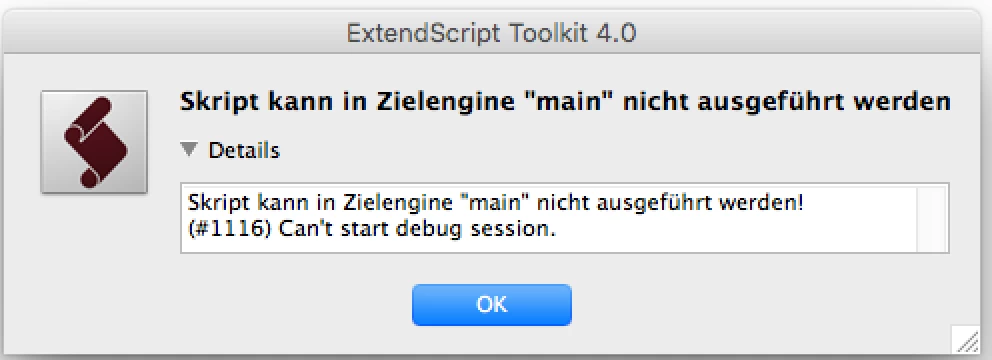
Starting from this morning I get the Error Message "(#1116) Can't start debug session." on my Mac for any target / Application.

ESTK 4.0.0.1

MacOS 10.13.6 (High Sierra)

Scrips are running, but the message is annoying. Any Ideas?

I had some minor security Updates on my Mac today. This guy on debugging - Extendscript Toolkit debugger fails: Can't start debug session - Stack Overflow  has the same problem starting from today. Anyone encountering this problem as well?

This topic has been closed for replies.
Correct answer erinferinferinf

OK, I have a more official fix, please give it a try:

So a possible workaround is to suggest the following to users

1.       Open the file(Mac): “/Applications/Adobe ExtendScript Toolkit CC/ExtendScript Toolkit.app/Contents/SharedSupport/Required/cdic/11BTBackend.jsx”

2.       Search for the value: 604800000 (line reads bt.timeout = 604800000)

3.       Replace that value with 604800 and save

4.       Quit ExtendScript Toolkit and relaunch.

A handful of third-party developers have verified this works.

Here's the cause of the error:

It looks like an issue because of signed 32-bit integer overflow that happens on this date “19 Nov 2018”.

In the implementation in the ESTK jsx file “/Applications/Adobe ExtendScript Toolkit CC/ExtendScript Toolkit.app/Contents/SharedSupport/Required/cdic/11BTBackend.jsx”, there is a timeout specified in milliseconds

“bt.timeout = 604800000;   // a week in milliseconds”.

The current time is(time(NULL)) since EPOCH: 1542783918 seconds.

Adding:  1542783918 + 604800000 = 2147583918(which crosses the range of 32 bit integer(2,147,483,647).)

Looks like it was a mistake putting 3 zeroes at the end because in BridgeTalk code... it expects timeout in seconds and not milliseconds. So bt.timeout should be 604800 and that will fix the overflow issue.

15 replies

New Participant
November 20, 2018

Same problem here!

we have found a first workaround: just change your date to any date before 20-nov-2018

and please: open a ticket at AdobeSupport!

Participating Frequently
November 20, 2018

I can confirm that workaround... but my colleagues don't like me sending mails from the past.. #timetraveler​

Loic.Aigon
Brainiac
November 20, 2018

Glad to see I am not alone. I even tried to desinstall/resinstall thinking of a corrupted application

Brainiac
November 20, 2018

Same problem with MacOS 10.7.5, ESTK 3.8, targeting CS6.

Going back a bit further, the built-in javascript debugger of InDesign CS (version 3) still works.

New Participant
November 20, 2018

I can say that the console output in ESTK is working, if that helps anyone (I am the person who posted at stackoverflow that grefel refers to). I just tested a .jsx with:

#target "photoshop"
$.writeln('test');
alert('test');

...and ran it via InDesign's script panel. Both the writeln() and alert() worked fine (in ESTK and Photoshop respectively). So if you need debug output for something, at least that seems to still work. Running the same script from within ESTK did yield the "Cannot execute script in target engine 'main'" and the "(#1116) Can't start debug session" error message, same as above (although that one is in German).

Adobe Expert
November 20, 2018

Did not update my MAC, nothing installed but this issue cropped today. On MAC OS 10.10.5

Participating Frequently
November 20, 2018

Yep. Me and my colleague have the same problem. Never read that error before. But it's kind of urgent.