Copy link to clipboard
Copied
Can someone help me with this issue? I've searched for a while on the internet and nothing to be found about this specific issue, I am getting "Direct 2D Drawbot Error - Invalid Widnow Handle. HRESULT: -2147023496
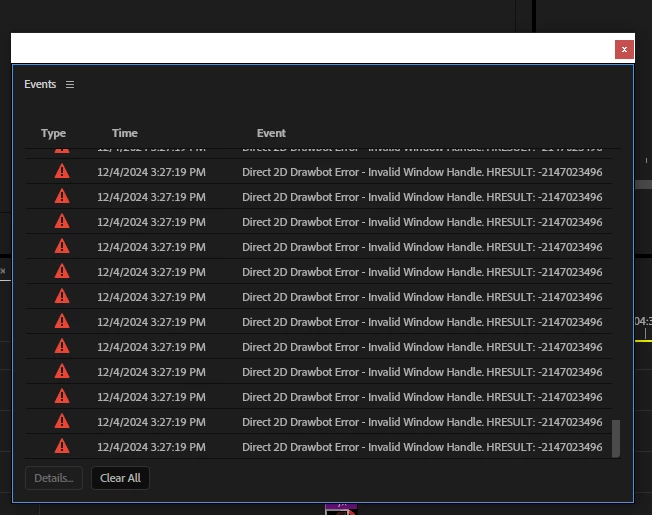
That's a screenshot of the Error, the timeline after a couple minutes are passed editing the project becomes completely unusable, I can only drag the playhead thru the timeline but nothing else, when I click any panel on the upper left such as "Sequence" I get all the options white, no option to be actually seen
I've been experiencing this since late 2024 builds but don't wanna downgrade back to 2024 as 2025 & Beta is running too smooth on my pc, except for this constant "crash" i get, since i have to reopen the app everytime this happens
I also have a screen recording of the bug happening on Beta, but it crashes instead of giving me any Error codes, on premiere 2025, though, if i wait after the bug happens it will give me the error code ive uploaded on the screenshot
Version I am currently using: latest premiere pro 2025 version but it would also happen on the 24.6+, including Beta versions. I can recall it didn't happen on a specific Beta build that was released a few days ago but I updated like a day later and it was back happening again
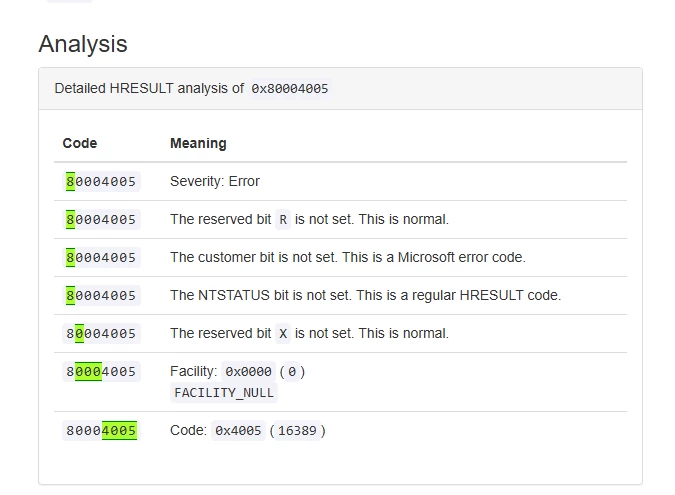
Also searched for the HRESULT value as hexadecimal and it returned me this
[Title edited by mod for clarity]
Hi @Pitepx - Would you be able to send me your project at jamiec@adobe.com I don't need the media, only the project.
If you open task manager and go to the details tab, then right click on columns and select GDI objects, While working in Premiere you can see the GDI objects rise. Any reproducible steps where you see this would be appreciated.
Also are you using 25.1 or 25.0?
Note: The smooth performance of 25 is due to new hardware acceleration of the underlying UI layer, and interactions with features have exposed interoperation issues causing leakage- right now the two things are directly connected. This error is connected to leaks connected to atypical way some pre-existing views were using resources. When combined with this new mode, some of those usages have enabled leaks which can use up app resources through repetitive usage.
Thank you very much for sharing
...Copy link to clipboard
Copied
If I was still a mod, I would retitle your bug report "Direct 2D Drawbot Error" in Pr25.x
You might do that yourself, or another mod. It gets more direct relevant informationt to the devs and anyone scanning the posts. The current title is useless.
Copy link to clipboard
Copied
Update: changed the GDIProcessHandleQuota to 65k as suggested by another user in another thread about the same kind of error but did not help
Copy link to clipboard
Copied
Hi @Pitepx - Thank you for the video it is extremely helpful. As we look to Isolate these GDI leaks. Can you provide some more information on what effect you are using in the effect controls? You can also isolate this by opening task manager selecting details, then right click on columns and select GDI objects, When you perform an action that you start to see the GDI objects rising is the information we need. As soon as it hits 10,000 your system will crash unless you have changed the registry to make that number higher. Any other reproducible steps that you can provide will help us fix it faster, so thank you for your help. If you need to get a project out without it crashing you can go to Preferences > General > "GPU accelerated UI rendering" checked off
Copy link to clipboard
Copied
@jamieclarke Thanks for your response, in fact changing the quota to 65k actually helped and it hasn't happened since, I got to around 15k and no problem was presented, hope you guys can fix the leak soon as I looked it up on google and apparently its hell to solve as a dev
I don't know exactly what info to give to you but the effects I use most and are also present on the screen recording are:
Crop
Turbulent Displace
Posterize Time
Transform (applied to an adjustment layer)
S_Dropshadow
Copy link to clipboard
Copied
Hi @Pitepx - Would you be able to send me your project at jamiec@adobe.com I don't need the media, only the project.
If you open task manager and go to the details tab, then right click on columns and select GDI objects, While working in Premiere you can see the GDI objects rise. Any reproducible steps where you see this would be appreciated.
Also are you using 25.1 or 25.0?
Copy link to clipboard
Copied
@jamieclarke As of now I'm using 25.1 but am thinking of reversing to 25.0 as 25.1 brought a problem with text I was having in Beta too (I talk about it here)
I will send you a couple projects in your email
Copy link to clipboard
Copied
Note: The smooth performance of 25 is due to new hardware acceleration of the underlying UI layer, and interactions with features have exposed interoperation issues causing leakage- right now the two things are directly connected. This error is connected to leaks connected to atypical way some pre-existing views were using resources. When combined with this new mode, some of those usages have enabled leaks which can use up app resources through repetitive usage.
Thank you very much for sharing the video and project. From the video and description it may be an interaction of filters on the timeline - this gets us in the ballpark, and will allow us to peel into this one, but there's still a number of moving parts we'll need to tease apart at this stage.
As Jamie has noted - the next step here is we'll be looking to isolate the specific repro action(s) which cause consistent, repeatable jumps of Windows OS GDI count, so folks know what to watch out for, and that's ultimately what we'll use for preparing fix. We'll want to capture that info next as a pre-req to the bug fix, and help other users know the repro of this bug.
In any case, Disabling UI hardware acceleration will provide stability here, with performance like releases prior to v25. Increasing the GDI object limit will merely delay how quickly the defect of GDI resource leak manifests in an app session, until the root issue on this case is isolated and fixed.
Copy link to clipboard
Copied
@Peter_Antal I've shared the project with him via mail as he asked, hope it can help you guys. About the UI Hardware acceleration thing: it causes the timeline to flicker when zoomed in & out, so I will probably keep restarting premiere pro when the GDI objects get to around 15-20k in task manager
Also, can this quota change from 10k to 65k cause any problems on my PC?
Copy link to clipboard
Copied
updating status.
Copy link to clipboard
Copied
The limit affects how much UI resources Windows OS allows application UI to use.
@Pitepx - That adjustable limit is not a generally used feature. Microsoft recommends keeping it at default level of 10k, they haven't called out specific hazards, and do acknowledge some apps do need more, but do note it has the potential to be abused by malicious applications also.
In practice, if you saw a bunch of other apps on your machine use more GDI resources than 10k, or behaving eratically you'd probably want to consier resetting that down.
The elevated quota should not normally be needed for Premiere, and once fixed, I'd advise against leaving it relaxed where not needed.
Copy link to clipboard
Copied
@Pitepx - Update: On Windows OS, I am currently unable to repro your GDI resource leak on playback using the project you shared to Jamie. With just the project as-is (no media) and as well with substitutions for offline files, GDI resource use was holding flat for me.
Unless @jamieclarke was able to found a trick to replicate on his end, it's looking likely there is a combination of specific formats and/or filters codepaths together with the hardware accelerated UI mode as neccessary to elicit this repro.
Jamie may have ideas on best way to deal with this kind repro'es, but for something like this I'd suggest a bare minimum "toy" project with small representative media file as ideal to replicate the leak - the full crash isn't necessary. With such a project loaded, I'd expect that when I play that content from timeline, windows task manager would track a steady rise of GDI objects from the "Details" pane, when "GDI Objects" are enabled as a column under observation.
Copy link to clipboard
Copied
@Peter_Antal I can try and get a whole collect of my current project which I am pretty sure would get a crash under the default 10k quota setting - upload it to G drive and send the link to jamie, let me know if that would be of your interest so I can go forward
As we are here, can you forward this topic to some1 to see if they can gimme any update on it?
Copy link to clipboard
Copied
Hi @Pitepx - Were you able to upload that project and media to us? Thank you for your help in troubleshooting and resolving your issue.
Copy link to clipboard
Copied
A share of repro Jamie and I indeed sounds good. Your full project isn't needed- you may find that could be a lot of media to share up.
We just need something representative to support replication the problem of the GDI leakage, as visible in the Windows task manager. The smallest timeline which still allows that is ideal to help with handling.
Copy link to clipboard
Copied
@Peter_Antal @jamieclarke Okay so today I accidentally deleted the whole folder where I would save my premiere pro projects, which is bad yeah I lost 2 or 3 days of work but apparently the problem is gone?
I've been editing for a couple hours w/o checking the GDI Objects, cause usually I only restart it when it hits around 45k and it took like 3/4 hours to hit around 40k.
After deleting my whole premiere pro projects folder I got only this in around 3 hours of work
(Premiere Pro is the 393 one) I don't know why it's apparently gone after deleting the folder where I saved all my projects from the last 6 months but I will keep working as usual and I'll see if it comes back later today.
Sorry for losing my other projects, I can still upload the media that wasn't in this folder, which are a couple copypastas' extension PNGs and I can also give you a copy of my current project that is not giving me the issue
I'm currently using the 25.0 build 61 btw
Copy link to clipboard
Copied
Thanks for the follow-up - Sorry to hear on your folder loss. Hmm, so the problem disappeared or slowed down substantially at the moment? If your repro has decided to make itself disappear, we probably won't be able to see it either.
We did put out a fix for an issue related to leakage in progress view dashboard into beta prime last week. I wouldn't have expected that to be elicited with what you saw with timeline, but may possibly explain.
P: Transcription leads to errors, video artifacts,... - Adobe Community - 14987974
It's also possible your repro was a very unusual set of factors combined, and your more recent editing hasn't tripped the same issue yet.
In any case, the GDI object report has been proving itself effective to help us narrow such culprits down, if similar leak situation is re-discovered going forward.
Copy link to clipboard
Copied
@Peter_Antal @jamieclarke after some time editing, the problem was still gone, then back, then gone again and honestly I can't know what I did to get it back, then gone, then back again. I'll be getting the project collect later today while I'm asleep since it will take a bit (it's a newer project with around 150 items so it is easier than the previous one which had like 2k)