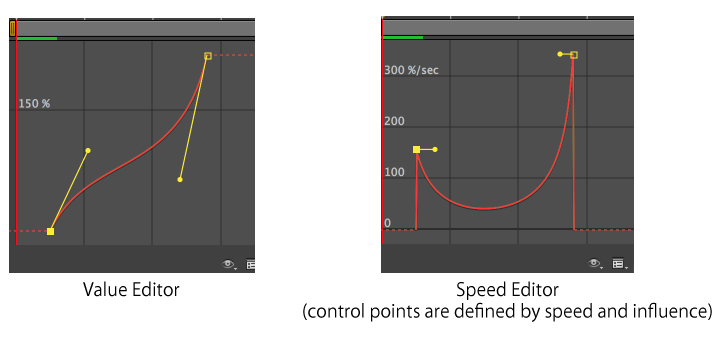
I'm really not sure about the mathematics, but I think something like this will work for conversion from speed to value graph.
var key, lastKey; // your keyframe objects
var duration = key.time - lastKey.time;
// only works for onedimensional properties, eg. rotation. maybe you have to use phytagoras for position, anchorpoint
var diff = Math.abs(key.value - lastKey.value);
var averageSpeed = diff / duration;
var bezierIn = {};
bezierIn.x = 1 - key.easeIn.influence / 100;
bezierIn.y = 1 - key.easeIn.speed / averageSpeed * bezierIn.x;
var bezierOut = {};
bezierOut.x = lastKey.easeOut.influence / 100;
bezierOut.y = lastKey.easeOut.speed / averageSpeed * bezierOut.x;
now you should have the relative position (0-1) of the two bezier handels for the value graph.
Message was edited by: ascii husky


 3
Replies
3
Replies


 AdChoices