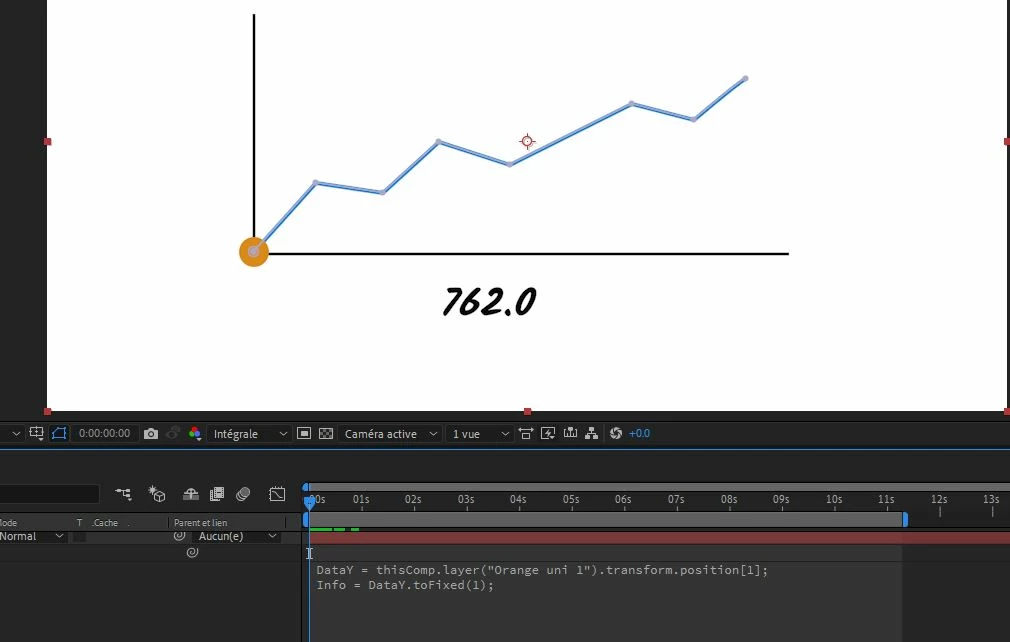
I would use the linear interpolation method from the Expression Language menu in the timeline to drive the text layer: linear(t, tMin, tMax, value1, value2)
All you have to do is define t as the Y value of your indicator ("Orange uni 1") and set tMin and tMax and the minimum and maximum Y value for the graph. Then you assign value1 as the highest value or top of the graph, and value2 as the lowest. This will convert your y position value into the numbers you need to properly display the values in the graph. Adding toFixed(1) to the end of the linear interpolation method completes the expression.
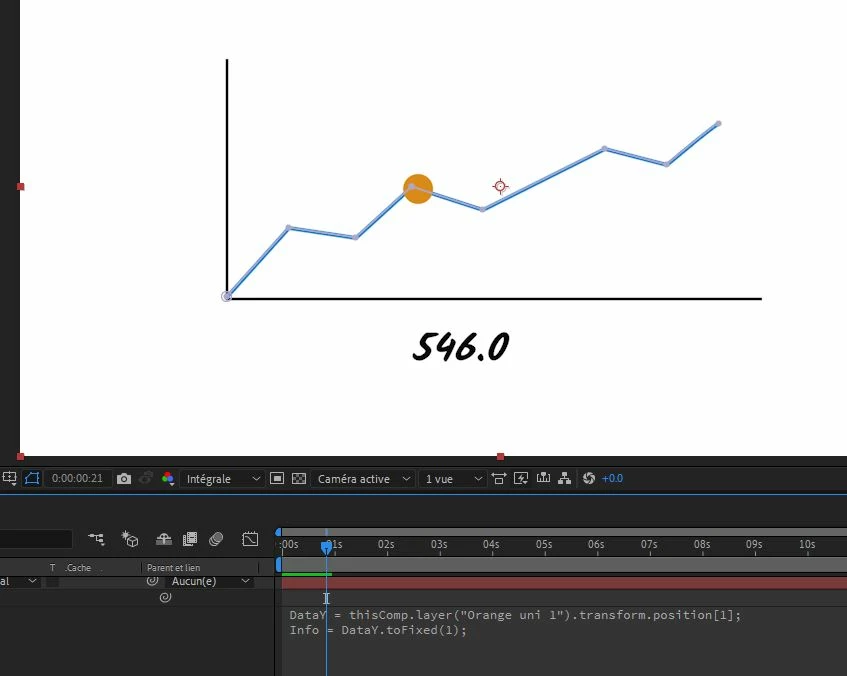
If the graph was 900 pixels tall and the top line was at 100 and the bottom was at 1000 and the scale of the graph was from zero to 500 then this would be the expression:
t = thisComp.layer("Orange uni 1").transform.position[1];
tMin = 1000;// Y value for the bottom of the graph
tMax = 100; // Y value for the top of the graph
value1 = 500; // highest value for graph
value2 = 0; // lowest value for graph
linear(t, tMin, tMax, value1, value2).toFixed(1);
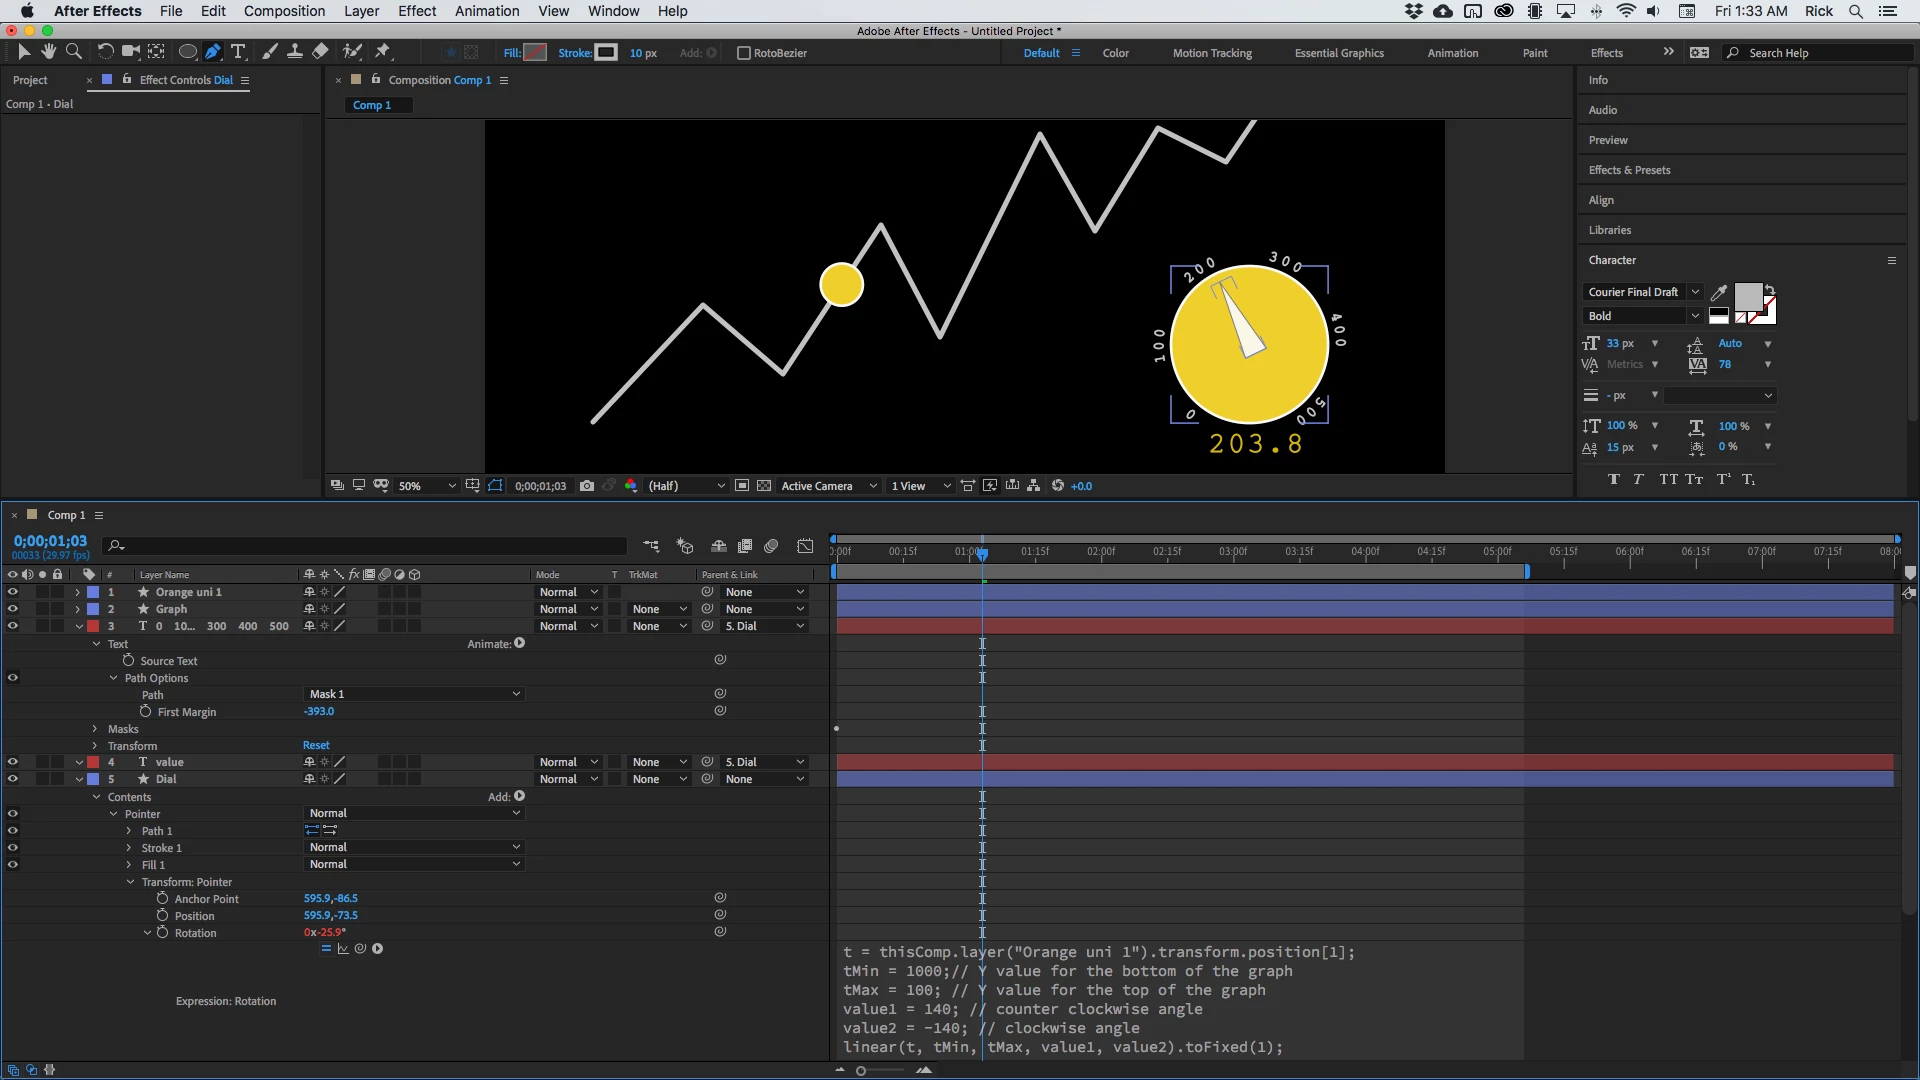
A radial display like a speedometer might be an easier way to view the data. Changing numbers can be hard to read. You would just modify the expression to drive the rotation of a pointer like this:
t = thisComp.layer("Orange uni 1").transform.position[1];
tMin = 1000;// Y value for the bottom of the graph
tMax = 100; // Y value for the top of the graph
value1 = 140; // counter clockwise angle
value2 = -140; // clockwise angle
linear(t, tMin, tMax, value1, value2).toFixed(1);
And you can end up with something like this in about 10 minutes: