- Home
- After Effects
- Discussions
- What's the math behind speed graphs?
- What's the math behind speed graphs?
Copy link to clipboard
Copied
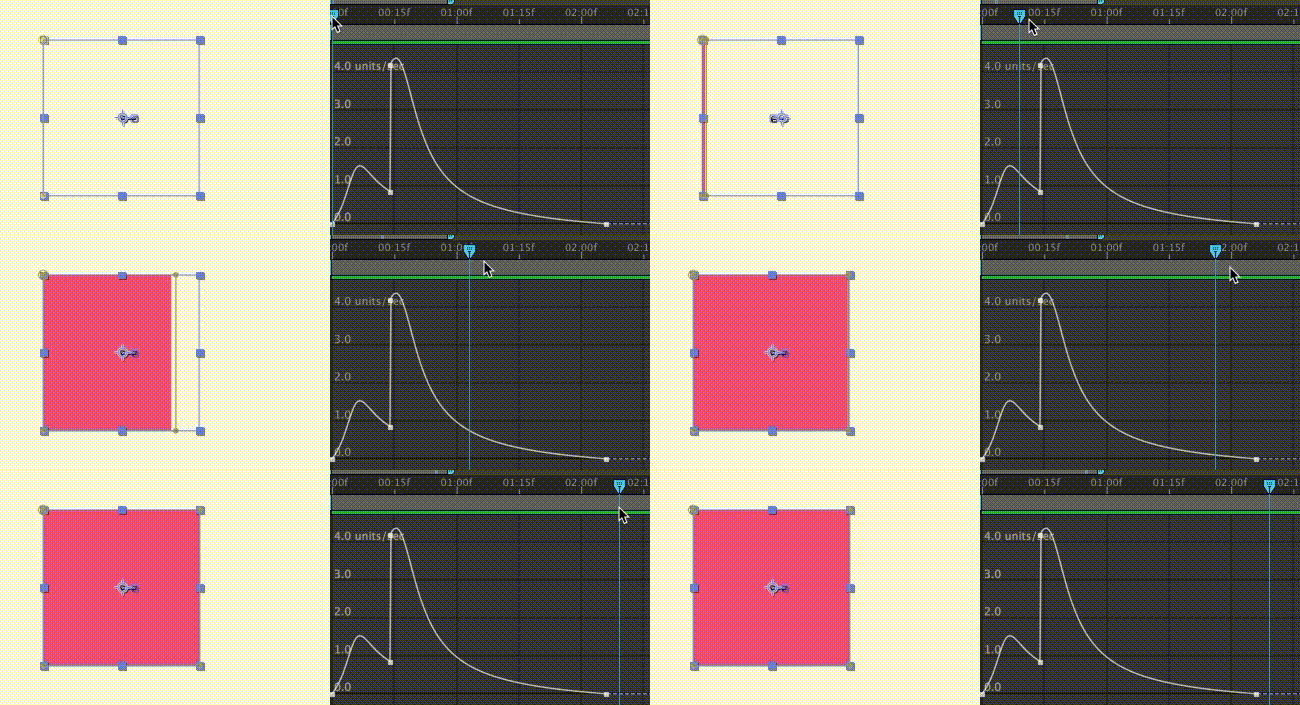
I used After Effects recently to design easing for objects in an interactive web graphic I'll be programming. For example, I animated a square's position and mask using the standard eases in the graph editor. Below shows the mask's speed graph which I'm interested in reproducing.

I'm fairly confident that eases on value graphs (e.g. position) are standard cubic Bezier curves, so position is a piece of cake. However, speed graphs behave differently: pushing both keyframes to zero makes a bell-shaped speed curve, not zero. It needs to do this preserve the total amount of change (the integral), which means that it is not a cubic Bezier curve, not directly anyways. I've had to hack together something that resembles the speed curve with some unsavory functions, and I'd prefer to match it exactly. Does anyone know how the curves in speed graphs work mathematically?
 1 Correct answer
The speed graph shows you units per second of overall motion. If you want to separate out X Y and Z values you need to separate values for Position before you start. Otherwise, all movement is averaged. A layer moving 100 pixels per second in X and 50 pixels in Y will not give you the same graph as a layer moving 150 pixels per second in x and zero in y. You just have to get used to it. Your speed graph shows an instantaneous speed change at the second keyframe the layer was slowing down then im
...Copy link to clipboard
Copied
The speed graph shows you units per second of overall motion. If you want to separate out X Y and Z values you need to separate values for Position before you start. Otherwise, all movement is averaged. A layer moving 100 pixels per second in X and 50 pixels in Y will not give you the same graph as a layer moving 150 pixels per second in x and zero in y. You just have to get used to it. Your speed graph shows an instantaneous speed change at the second keyframe the layer was slowing down then immediately sped up for a couple of frames and then started to slow down again until the motion stopped at the last keyframe. The way to know if the motion works is to run a ram preview and see how it looks. You can then tweak it by manipulating the speed graph but it takes some experience to be able to look at the speed graph and predict the movement. Sometimes looking at reference value graphs will help interpret the speed curves.
Find more inspiration, events, and resources on the new Adobe Community
Explore Now