• Global community
    • Language:
      • Deutsch
      • English
      • Español
      • Français
      • Português
  • 日本語コミュニティ
    Dedicated community for Japanese speakers
  • 한국 커뮤니티
    Dedicated community for Korean speakers
Exit
2

P: Transcription leads to errors, video artifacts, glitches

Enthusiast ,
Nov 18, 2024 Nov 18, 2024

Copy link to clipboard

Copied

Premiere Pro 25.0, Nvidia Studio driver 566.14, Intel Core-i7 14700k, RTX 4080, 64 Gb of ram, fast SSDs with plenty of free space.

Each time I try to use transcribation, it first starts and goes on but then it leads to multiple glitches.

This is how it looks:

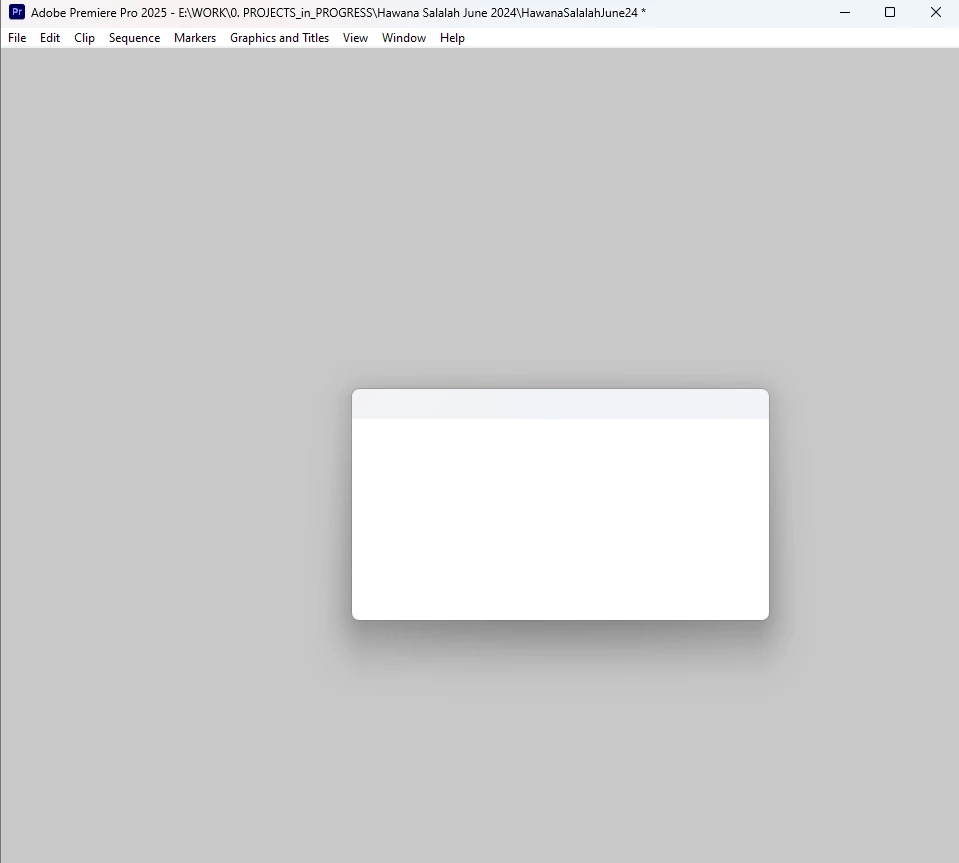
The process of transcribation goes on gradually but I cannot see the progress because Premiere Pro hangs though some its tabs continue to respond. After the transcribation is over, Premiere Pro stays unresponsive, so if you minimize it and maximize again you see this white window:

Снимок экрана 2024-11-18 183439.png

I would assume that it's the video driver but Ctrl+Alt+Win+B to reset it doesn't help.

I cannot save the project because when I do that I see this and cannot click any button, ctrl+S doesn't work either:
AndrewTheGreat_0-1731944282209.png


Steps to reproduce:

Open Premiere Pro, import several video files (3840 x 2160, 23,976 fps, MP4 H.264 4:2:0), select them all, choose Transcribe.

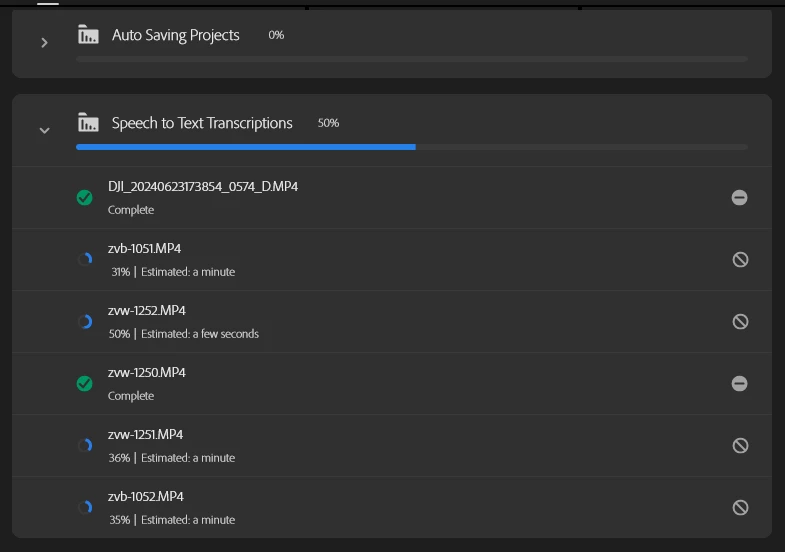
My obserations: this may be happening when this process info window is opened:
AndrewTheGreat_1-1731944793043.png

I tried to retranscribe several times and with this window closed it was fine. Only once I opened this window and got this glitch again. 

Also with this window not active the transcribation process never stops and goes much faster (as it should).

Another moment - there were suggestions that Premiere Pro v.25 my have vidual glitches like that if Chrome is running at the same time, like there may be a conflict between these two. I checked it - Chrome does not matter. Only this progress info in Premiere does.


UPD: a colleague of mine confirmed the same bug on his system using the same scenario on i5-13500, 64 Gb of Ram, 3070Ti, same Pr version, same video driver.


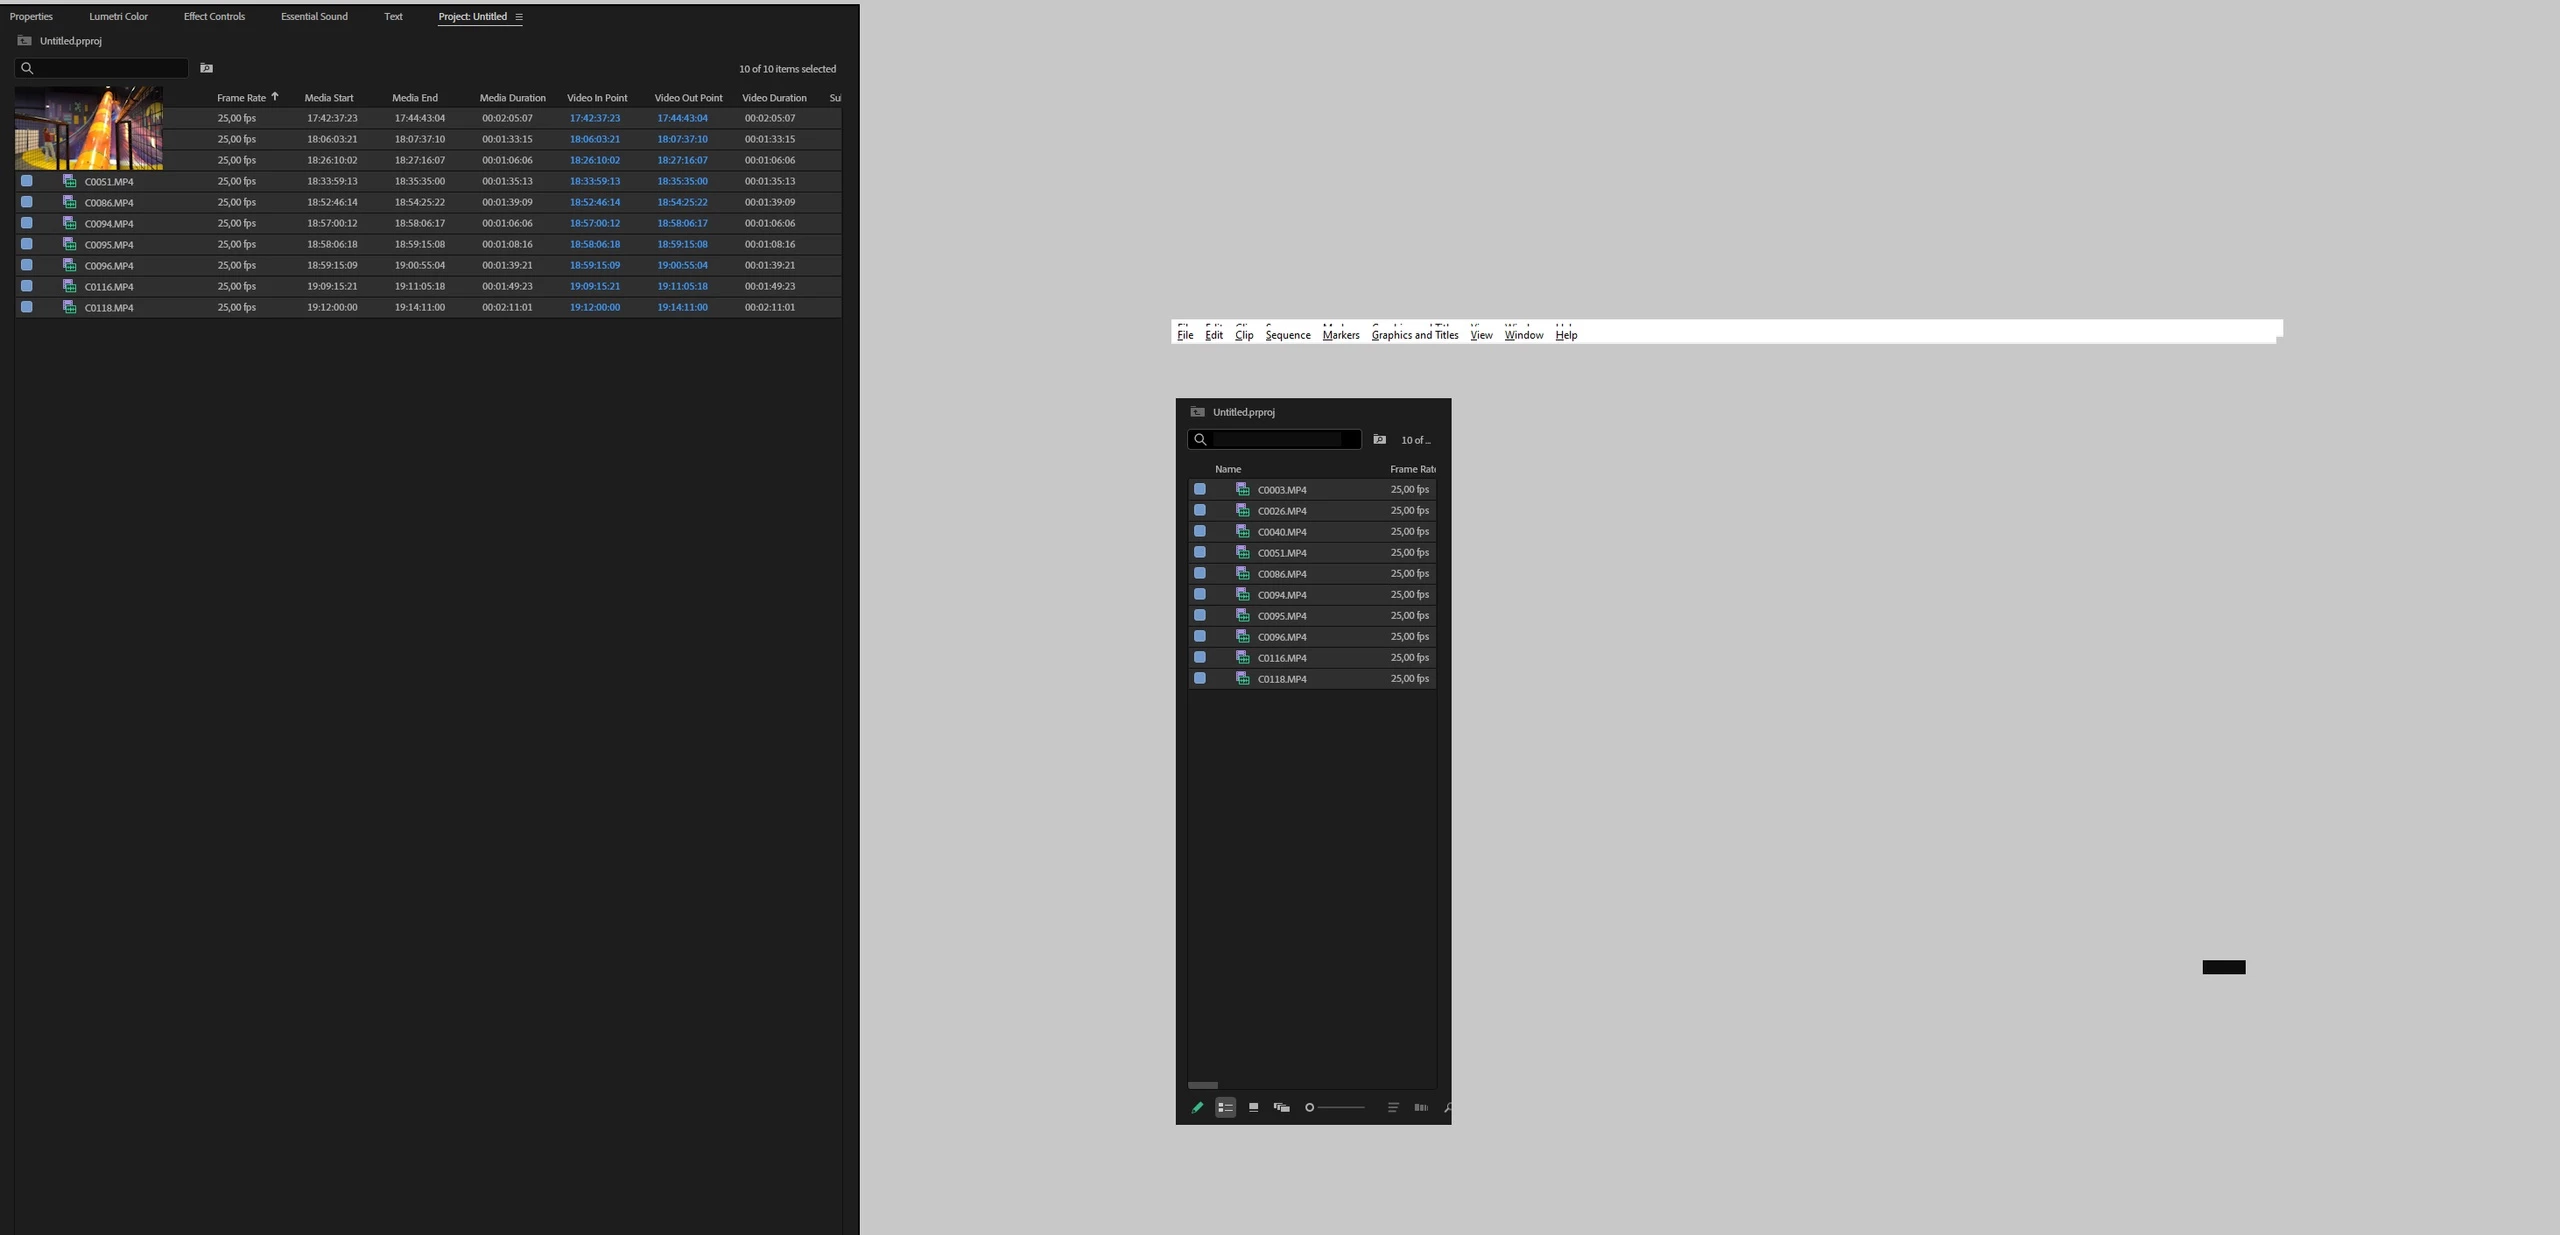
Upd2: same issue on Win11 / Pr 2025

14900k (igpu turned off in Bios) + Rtx 3080 + 128Gb
PF4je4JIcCQsyAVm7sk2LJZOlScFBBIN3h9mpqtu8Eiz1mtXUZKAZCKvvPSZB6PI9aSO1BvxsJl-xTia8ibOanfH.jpg

Bug Acknowledged
TOPICS
Editing and playback , Performance or Stability , User experience or interface

Views

540

Translate

Translate

Report

Report
Community guidelines
Be kind and respectful, give credit to the original source of content, and search for duplicates before posting. Learn more
community guidelines

correct answers 2 Pinned Replies

Adobe Employee , Nov 18, 2024 Nov 18, 2024

Hi @AndrewTheGreat - It looks like you are running into some memory leaks within Premiere Pro.  You can tell in task manager under details if you select columns and choose "GDI objects", if that number goes over 10,000 you will see these errors.


We have addressed a bunch of these issues within the next version.  Can you try installing the latest beta 25.2 and let us know if that helps your issue?

Status Needs More Info

Votes

Translate

Translate
Adobe Employee , Nov 21, 2024 Nov 21, 2024

Updating Status to Acknowledged

Status Acknowledged

Votes

Translate

Translate
23 Comments
Adobe Employee ,
Nov 18, 2024 Nov 18, 2024

Copy link to clipboard

Copied

Hi @AndrewTheGreat - It looks like you are running into some memory leaks within Premiere Pro.  You can tell in task manager under details if you select columns and choose "GDI objects", if that number goes over 10,000 you will see these errors.


We have addressed a bunch of these issues within the next version.  Can you try installing the latest beta 25.2 and let us know if that helps your issue?

Status Needs More Info

Votes

Translate

Translate

Report

Report
Enthusiast ,
Nov 18, 2024 Nov 18, 2024

Copy link to clipboard

Copied

Hi, @jamieclarke 

I'll give beta a try tomorrow. For now I've updated the first message with another case

Votes

Translate

Translate

Report

Report
Enthusiast ,
Nov 19, 2024 Nov 19, 2024

Copy link to clipboard

Copied

Hi, @jamieclarke 

Unfortunately Beta acts the same way:

And in the end I get the same empty window:

Снимок экрана 2024-11-19 125023.png

This all feels pretty bad...

Votes

Translate

Translate

Report

Report
Adobe Employee ,
Nov 19, 2024 Nov 19, 2024

Copy link to clipboard

Copied

Hi @AndrewTheGreat - Thank you for the screen recording and for trying the beta.  If you click transcribe on the files individually do they complete?  I see that Premiere seems to finish one file and then stop on the others.  


Why do you have your iGPU off.  Quicksync will definitely improve your editing inside Premiere Pro.


I'm not saying this is the issue but wanted to make sure you knew about the problem with Intel and their Raptor Lake processors that you currently have.  Here is a good article

I know bios updates were rolling out, but haven't heard much since.

Votes

Translate

Translate

Report

Report
Enthusiast ,
Nov 19, 2024 Nov 19, 2024

Copy link to clipboard

Copied

@jamieclarke 

I especially drew your attention to this progress dashboard window which ruins the software. If you do not open it, do not touch it, do not breath on it, the trenscription runs fine and finishes. I managed to complete like a hundred clips transcribation so far - I just didn't touch this window.


As for the iGPU being off - it's another case my colleague sent me info about, that's what he'd experienced on his 14900K with the iGPU off. Why was it off? Because of that: https://community.adobe.com/t5/premiere-pro-discussions/intel-igpu-behaving-strangely-in-premiere-pr... Another problem that has some deep-root cause.


I know everything about the iGPU, how it works and what video formats it's capable to decode, I know about the Intel case (I've the latest microcode update installed) This is not connected with the problem here. I just wanted you to know that this issue is reproduced on systems both with an iGPU and without it.

Votes

Translate

Translate

Report

Report
Adobe Employee ,
Nov 19, 2024 Nov 19, 2024

Copy link to clipboard

Copied

Hi @AndrewTheGreat - I can definitely repro your issue in version 25, but not in the beta 25.2.0.22. as mentioned before the GDI objects have a memory leak and that is what you are experiencing.

That is an interesting article about your iGPU thank you for sharing and you are right I don't want to derail your initial problem.  I am more curious about your iGPU problem I will continue a conversation on that thread.


Votes

Translate

Translate

Report

Report
Enthusiast ,
Nov 19, 2024 Nov 19, 2024

Copy link to clipboard

Copied

@jamieclarke 

So I tested it in beta 25.2.0.21 and you say beta 25.2.0.22 has it fixed, right? Ok, I'll check it and reply

Votes

Translate

Translate

Report

Report
Enthusiast ,
Nov 19, 2024 Nov 19, 2024

Copy link to clipboard

Copied

@jamieclarke 

Where did you get beta 25.2.0.22? Beta 25.2.0.21 is only available in CC

Votes

Translate

Translate

Report

Report
Adobe Employee ,
Nov 19, 2024 Nov 19, 2024

Copy link to clipboard

Copied

Hi @AndrewTheGreat - It was released today so it could have taken awhile to populate depending on your location.  In the creative cloud desktop app if you are on the app tab and then view updates you can click "Check for Updates" in the upper right corner.  

Votes

Translate

Translate

Report

Report
Enthusiast ,
Nov 19, 2024 Nov 19, 2024

Copy link to clipboard

Copied

Hi, @jamieclarke 

Checked on build 22 of the Beta. And it's not only the same, Premiere Pro just crashes at about 62% of the transcribation process. I ran it 3 times, all the three times it crashed. Also tried to create a new project and it's all the same.


Votes

Translate

Translate

Report

Report
Adobe Employee ,
Nov 20, 2024 Nov 20, 2024

Copy link to clipboard

Copied

HI @AndrewTheGreat - Would you be able to provide a sample of these files so that we can try and reproduce?  If not, can you provide the media file properties using mediainfo.

Votes

Translate

Translate

Report

Report
Enthusiast ,
Nov 20, 2024 Nov 20, 2024

Copy link to clipboard

Copied


@jamieclarke 


General
Complete name                  : E:\WORK\zvb-1051.MP4
Format                         : XAVC
Codec ID                       : XAVC (XAVC/mp42/iso2)
File size                      : 25.9 GiB
Duration                       : 37 min 42 s
Overall bit rate mode          : Variable
Overall bit rate               : 98.5 Mb/s
Frame rate                     : 23.976 FPS
Encoded date                   : 2024-07-24 12:43:19 UTC
Tagged date                    : 2024-07-24 12:43:19 UTC

Video
ID                             : 1
Format                         : AVC
Format/Info                    : Advanced Video Codec
Format profile                 : High@L5.1
Format settings                : CABAC / 2 Ref Frames
Format settings, CABAC         : Yes
Format settings, Reference fra : 2 frames
Format settings, Slice count   : 8 slices per frame
Codec ID                       : avc1
Codec ID/Info                  : Advanced Video Coding
Duration                       : 37 min 42 s
Bit rate mode                  : Variable
Bit rate                       : 96.0 Mb/s
Maximum bit rate               : 100.0 Mb/s
Width                          : 3 840 pixels
Height                         : 2 160 pixels
Display aspect ratio           : 16:9
Frame rate mode                : Constant
Frame rate                     : 23.976 (24000/1001) FPS
Color space                    : YUV
Chroma subsampling             : 4:2:0
Bit depth                      : 8 bits
Scan type                      : Progressive
Bits/(Pixel*Frame)             : 0.483
Stream size                    : 25.3 GiB (97%)
Encoded date                   : 2024-07-24 12:43:19 UTC
Tagged date                    : 2024-07-24 12:43:19 UTC
Color range                    : Limited
Color primaries                : BT.709
Transfer characteristics       : xvYCC
Matrix coefficients            : BT.709
Metas                          : 3
Codec configuration box        : avcC

Audio
ID                             : 2
Format                         : PCM
Format settings                : Big / Signed
Codec ID                       : twos
Duration                       : 37 min 42 s
Bit rate mode                  : Constant
Bit rate                       : 1 536 kb/s
Channel(s)                     : 2 channels
Sampling rate                  : 48.0 kHz
Bit depth                      : 16 bits
Stream size                    : 414 MiB (2%)
Encoded date                   : 2024-07-24 12:43:19 UTC
Tagged date                    : 2024-07-24 12:43:19 UTC

Other
ID                             : 3
Type                           : meta
Format                         : rtmd
Codec ID                       : rtmd
Duration                       : 37 min 42 s
Bit rate mode                  : Constant
Encoded date                   : 2024-07-24 12:43:19 UTC
Tagged date                    : 2024-07-24 12:43:19 UTC


Votes

Translate

Translate

Report

Report
Adobe Employee ,
Nov 21, 2024 Nov 21, 2024

Copy link to clipboard

Copied

Hi @AndrewTheGreat - I wanted to update you, I was able to find a windows 10 PC with an AMD chip and am now able to reproduce the error you are experiencing.  I will get this filed and keep you updated on when it is fixed.

Votes

Translate

Translate

Report

Report
Adobe Employee ,
Nov 21, 2024 Nov 21, 2024

Copy link to clipboard

Copied

Updating Status to Acknowledged

Status Acknowledged

Votes

Translate

Translate

Report

Report
Enthusiast ,
Nov 22, 2024 Nov 22, 2024

Copy link to clipboard

Copied

Hi, @jamieclarke 

It's strange that you could reproduce the issue on an AMD CPU but couldn't do it on an Intel. I have 2 more friends that faced this issue on their Intels, so it makes 5 Intels count in my experience... Therefore, having an AMD in our rows means the CPU does not matter.

Votes

Translate

Translate

Report

Report
Adobe Employee ,
Nov 22, 2024 Nov 22, 2024

Copy link to clipboard

Copied

Hi @AndrewTheGreat - I agree with you.  I believe it's a difference between Windows 10 and Windows 11, but waiting to hear from the developers.

Votes

Translate

Translate

Report

Report
Adobe Employee ,
Dec 04, 2024 Dec 04, 2024

Copy link to clipboard

Copied

@AndrewTheGreat  - FYI we're looking more closely at the details, but it looks like there's an unique interaction of the recent D2D GPU UI feature which first shipped in with Premiere V25 release and the progress dashboard view. Toggling the hierarchy in that view especially drives a rapid leak.

Windows 10 vs 11 doesn't seem to matter for this one.


We're investigating the root cause of unusual resource use which doesn't clean up for that particular view, but the problem interaction does not repro if you disable "GPU accelerated UI renderering" from General Preferences. I'd recommend turning that mode off on your environment as a stable mitigation in the interim until a fix can be made available.

Peter_Antal_0-1733363201790.png


Votes

Translate

Translate

Report

Report
Enthusiast ,
Dec 05, 2024 Dec 05, 2024

Copy link to clipboard

Copied

Hi, @Peter_Antal

Good to know there is a particular cause of this behavior. Switching it off as of right now.

Votes

Translate

Translate

Report

Report
Community Expert ,
Dec 05, 2024 Dec 05, 2024

Copy link to clipboard

Copied

@AndrewTheGreat Kudos to you for identifying the problem and persisting in helping sort it out. I tend to briefly turn the progress dashboard on and off, and never saw the issue.


And to you, @jamieclarke, for getting developer attention.


Stan


Votes

Translate

Translate

Report

Report
Enthusiast ,
Dec 05, 2024 Dec 05, 2024

Copy link to clipboard

Copied

Well, @Peter_Antal

I don't think this is usable with all this flickering and stuff... This is what happens if you turn off the UI acceleration. I think I'll keep this one on and wait for a fix...


Votes

Translate

Translate

Report

Report
Adobe Employee ,
Dec 05, 2024 Dec 05, 2024

Copy link to clipboard

Copied

@AndrewTheGreat - We've got a candidate fix for the leak in review now, to correct for the interoperation issue between the UI tech of that panel, and hardware accelerated UI on Windows. The problem wasn't unique to that progress view, so this may also help for a narrow set of similar popups using the similar, but uncommon combination of components. I'll circle back when it's confirmed as included in Betaprime builds.

I've repro'ed and filed a separate bug about your flickering observation particularly on resize w/GPU acceleration is disabled. We'll want to make sure the fallback path remains usable for transient issues like GPU driver bugs, even after these initial issues are all mopped up. Thanks for bringing that to our attention.

Votes

Translate

Translate

Report

Report
Adobe Employee ,
Dec 06, 2024 Dec 06, 2024

Copy link to clipboard

Copied

Update: A fix for GDI resource leakage was applied for the kind of popups used by the Progress Dashboard as well as the Quick Export action, with resource usage in line with V5. That change will be part of Beta builds after today, and included with next release.


Votes

Translate

Translate

Report

Report
Community Expert ,
Dec 14, 2024 Dec 14, 2024

Copy link to clipboard

Copied

LATEST

@AndrewTheGreat,


A second round of congratulations on your identifying the progress dashboard as an element in this. I found the same thing when testing a long transcription and finding one of the other D2D bug threads. Adding the GDI column to task manager was a real eye opener:

https://community.adobe.com/t5/premiere-pro-bugs/direct-2d-drawbot-error-invalid-widnow-handle-hresu...


@Peter_Antal,


Just confirmation that I see this clearly in PR 25.0.0 and NOT in Beta 25.2.0.50. With the Progress Dashboard open, PR adds GDI counts till it maxed out and I get the white screen etc. If it matters now, I was transcribing a 58 minute .mp4 imported to a new project. Probably not relevant, but this was a file with 3 stereo audio tracks and I transcribed to Channel 1 so it did not need to do any special processing for the "mix."


I mistook the symptoms reported in the various "Direct 2D Drawbot" threads for a video driver issue and updated my RTX 3070 to 566.36 and, I now realize, as expected, it made no difference. I also updated the Intel graphics driver which also made no difference.


My experience of the PR unresponsive state was that I could get some function back by minimizing this and that until I could access the File -> Save command. This confirmed that the transcript had in fact finished and was available when the project was reopened.


I assume this problem is also present in 25.1.0. I am putting off updating until I complete a project.


Stan

Votes

Translate

Translate

Report

Report